
Mastering technical indicators is a fundamental skill for every Forex trader. Among the hundreds of available indicators, three stand out as the most widely used and consistently reliable: the Relative Strength Index (RSI), Moving Average Convergence Divergence (MACD), and Bollinger Bands. This complete guide explains each indicator in depth, shows you how to use them individually, and demonstrates how to combine all three for a high-probability trading strategy in 2026.

Relative Strength Index (RSI): The Momentum Oscillator
The RSI, developed by J. Welles Wilder in 1978, measures the speed and magnitude of price changes on a scale of 0–100. It remains one of the most popular Forex indicators 45 years after its creation — for good reason.
RSI Key Levels & Signals
| RSI Level | Signal | Action |
|---|---|---|
| Above 70 | Overbought | Look for short setups or exit longs |
| 50–70 | Bullish momentum | Favor long positions |
| 50 (crossover) | Trend change signal | Key level for bias determination |
| 30–50 | Bearish momentum | Favor short positions |
| Below 30 | Oversold | Look for long setups or exit shorts |
RSI Divergence — The Most Powerful Signal
Bullish RSI Divergence: Price makes a lower low, but RSI makes a higher low → signals potential reversal to the upside. This is one of the highest-probability setups in technical analysis.
Bearish RSI Divergence: Price makes a higher high, but RSI makes a lower high → signals potential reversal to the downside. Look for this in overbought conditions (RSI 65–75) for short entries.
Best RSI settings for Forex: Period 14 (default) works well for daily and H4 timeframes. For scalping on M15, some traders prefer RSI(9) for faster signals.

MACD: Trend Following & Momentum
The Moving Average Convergence Divergence (MACD) combines trend-following and momentum into a single indicator. It consists of three components: the MACD line (12-period EMA minus 26-period EMA), the Signal line (9-period EMA of MACD), and the Histogram.
Key MACD Trading Signals
- Bullish crossover: MACD line crosses above Signal line → buy signal (strongest when below zero)
- Bearish crossover: MACD line crosses below Signal line → sell signal (strongest when above zero)
- Zero-line cross: MACD crossing above zero confirms bullish trend; below zero confirms bearish
- Histogram expansion: Growing bars indicate strengthening momentum in current direction
- Histogram contraction: Shrinking bars warn of momentum loss and potential reversal
Best Pairs & Timeframes for MACD
MACD works best on trending pairs in the H1, H4, and Daily timeframes. EUR/USD, GBP/USD, and USD/JPY respond particularly well to MACD signals due to their strong trending characteristics. Avoid using MACD alone in ranging, low-volatility markets — it generates excessive false signals.
Bollinger Bands: Volatility & Range Trading
Bollinger Bands, created by John Bollinger, consist of a 20-period simple moving average (middle band) with upper and lower bands set 2 standard deviations away. They dynamically expand during high volatility and contract during low volatility.
Core Bollinger Bands Strategies
- Bollinger Squeeze: When bands narrow significantly (low volatility), a major breakout is imminent. Trade the breakout direction once price closes outside the band with volume confirmation.
- Mean Reversion: Price touching the upper band in a range → short opportunity back to middle band. Price touching lower band → long opportunity. Works best in ranging, low-momentum markets.
- Band Riding: In strong trends, price can “ride” the upper or lower band for extended periods. During an uptrend, pullbacks to the middle band (20 SMA) offer high-quality long entries.

Combining RSI + MACD + Bollinger Bands: A Complete Strategy
Using all three indicators together creates a powerful, multi-confirmation trading system. Here’s a proven setup:
Long Entry Rules (Buy Signal)
- ✅ RSI between 30–50 (recovering from oversold) or showing bullish divergence
- ✅ MACD bullish crossover OR histogram turning positive
- ✅ Price touching or near the lower Bollinger Band
- ✅ Price is above the 200-period MA (overall uptrend context)
- ➡️ Enter long, stop below recent low, target middle or upper Bollinger Band
Short Entry Rules (Sell Signal)
- ✅ RSI between 50–70 (retreating from overbought) or showing bearish divergence
- ✅ MACD bearish crossover OR histogram turning negative
- ✅ Price touching or near the upper Bollinger Band
- ✅ Price is below the 200-period MA (overall downtrend context)
- ➡️ Enter short, stop above recent high, target middle or lower Bollinger Band
FAQ — Technical Indicators for Forex
Which indicator is best for Forex beginners?
RSI is typically recommended for beginners because it’s simple, visually intuitive, and provides clear overbought/oversold signals. Start with RSI on the H4 or Daily chart on EUR/USD before adding MACD and Bollinger Bands to your analysis.
Can I use these indicators on all timeframes?
Yes, but effectiveness varies. Higher timeframes (H4, Daily) produce more reliable signals with fewer false positives. Lower timeframes (M5, M15) generate more signals but also more noise. Most professional traders rely on multi-timeframe analysis — checking the daily trend with indicators, then timing entries on H1 or H4.
Should I use all three indicators together?
Combining indicators from different categories (momentum + trend + volatility) reduces false signals. However, avoid adding too many indicators — it creates “analysis paralysis.” RSI + MACD + Bollinger Bands is a complete system. Keep it simple and stick to your rules.
Risk Disclaimer: Technical indicators do not guarantee profitable trades. Forex trading involves significant risk. Always use stop-loss orders and proper position sizing. This guide is for educational purposes only.
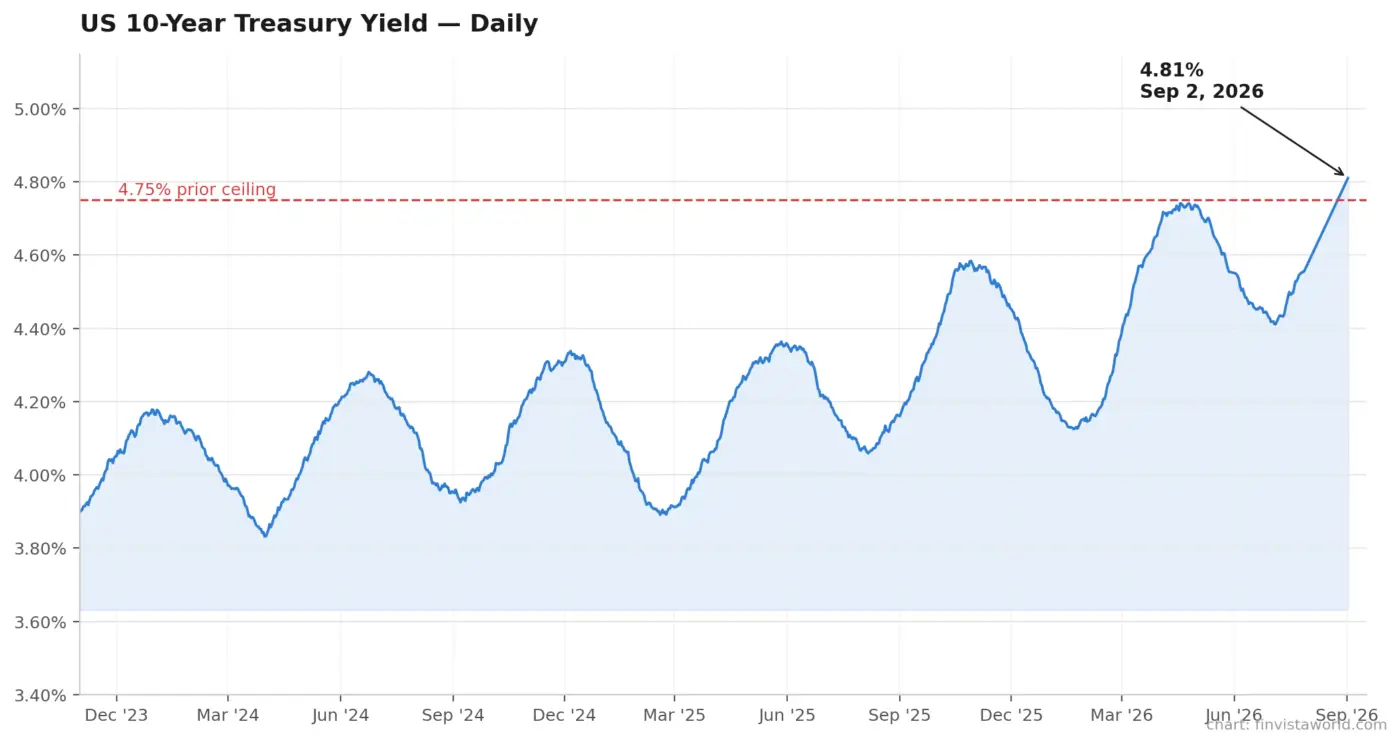 ADP Jobs Miss Collides With Rising Yields: Wall Street Stalls as 10-Year Hits 4.81%
 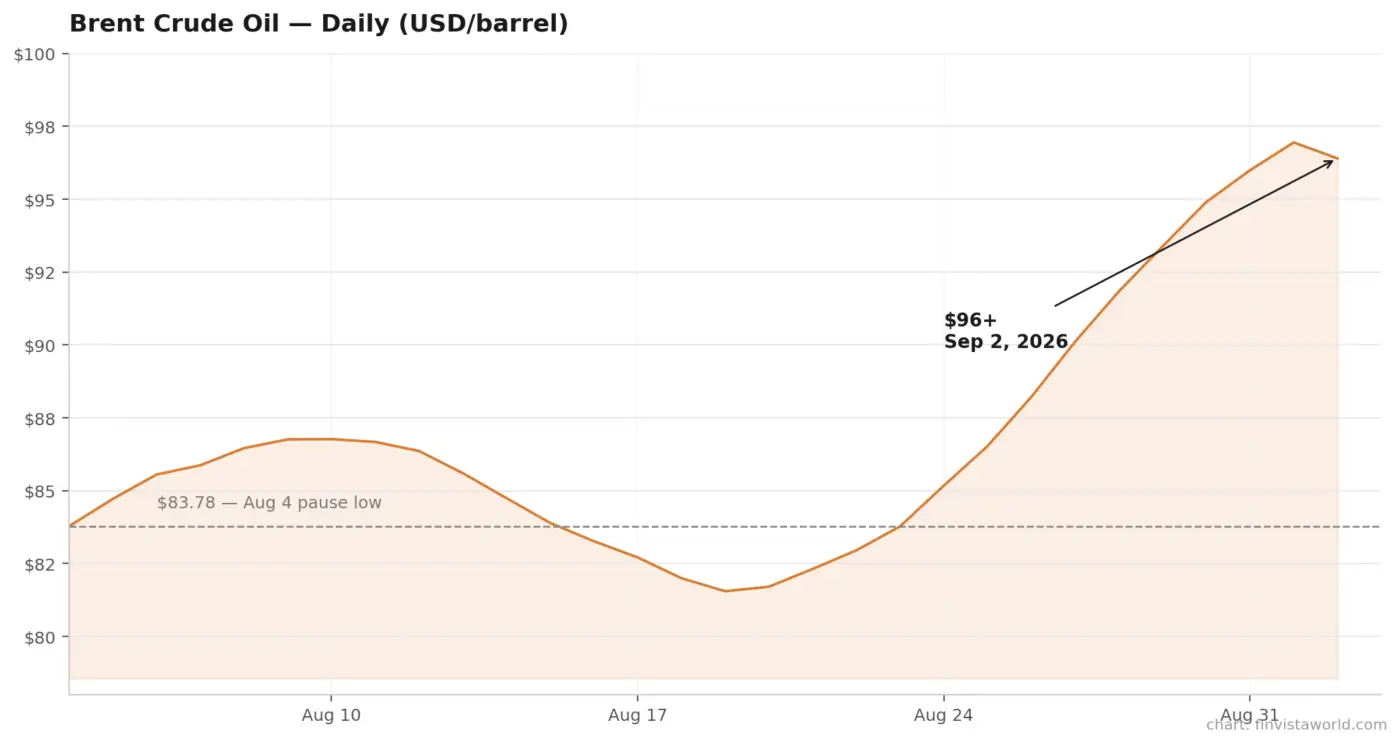 Iran War Reignites: Oil Tops $96, Stocks and Gold Slide Together as Fed Rate-Hike Odds Hit 70%
  Oil Sinks 6%, Dow Hits Record High as Iran Pause Reprices Markets – Crypto Sits It Out
 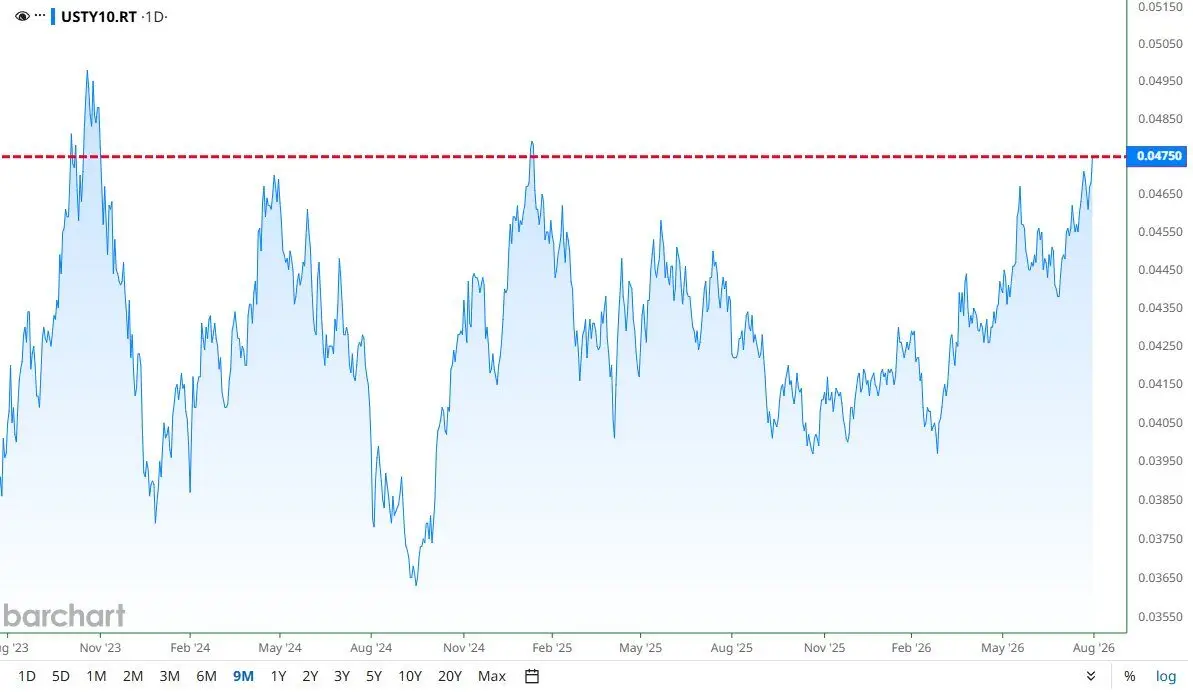 10-Year Yield Hits 4.75%, an 18-Month High – Why the Bond Market Is About to Revolt
  Bond Market Puts Warsh’s 2% Promise to the Test as 30-Year Yield Hits 19-Year High
 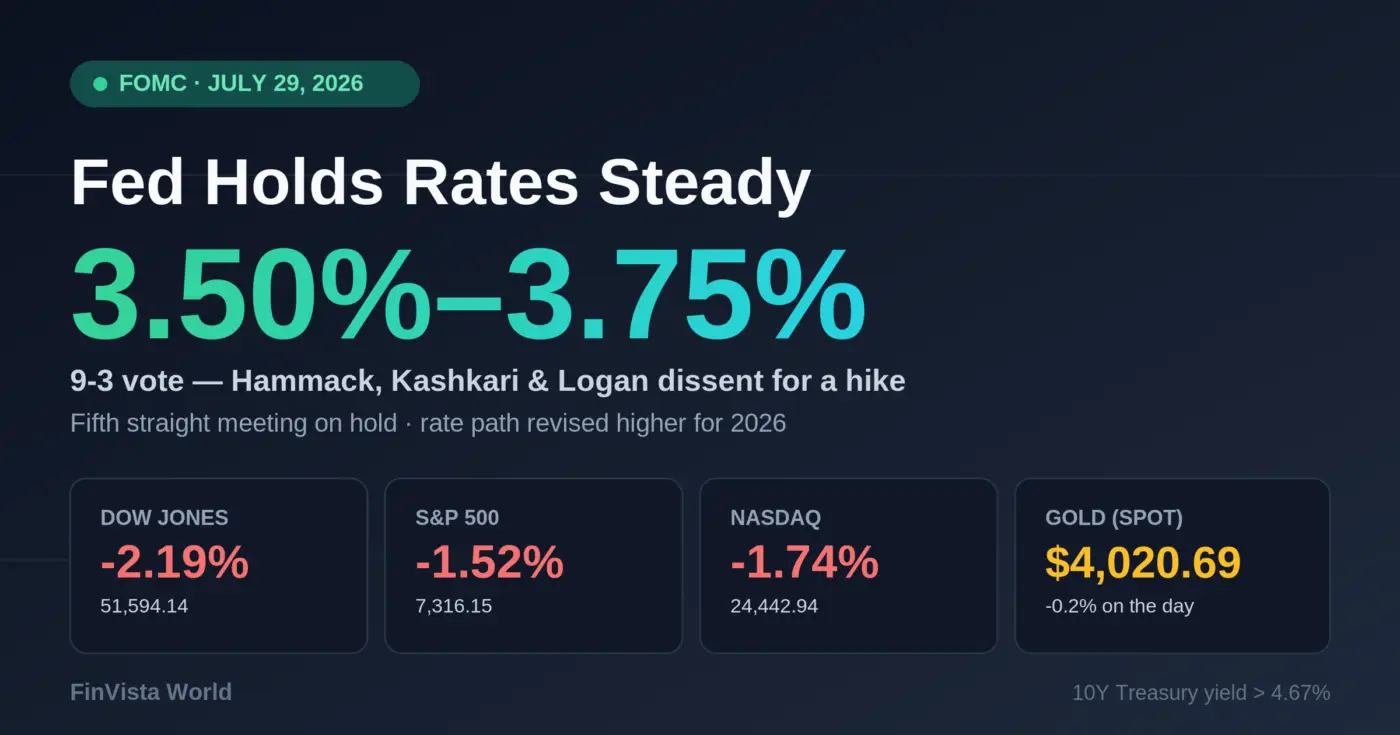 Fed Holds Rates Steady at July 2026 Meeting as Three Officials Dissent, Stocks Tumble