
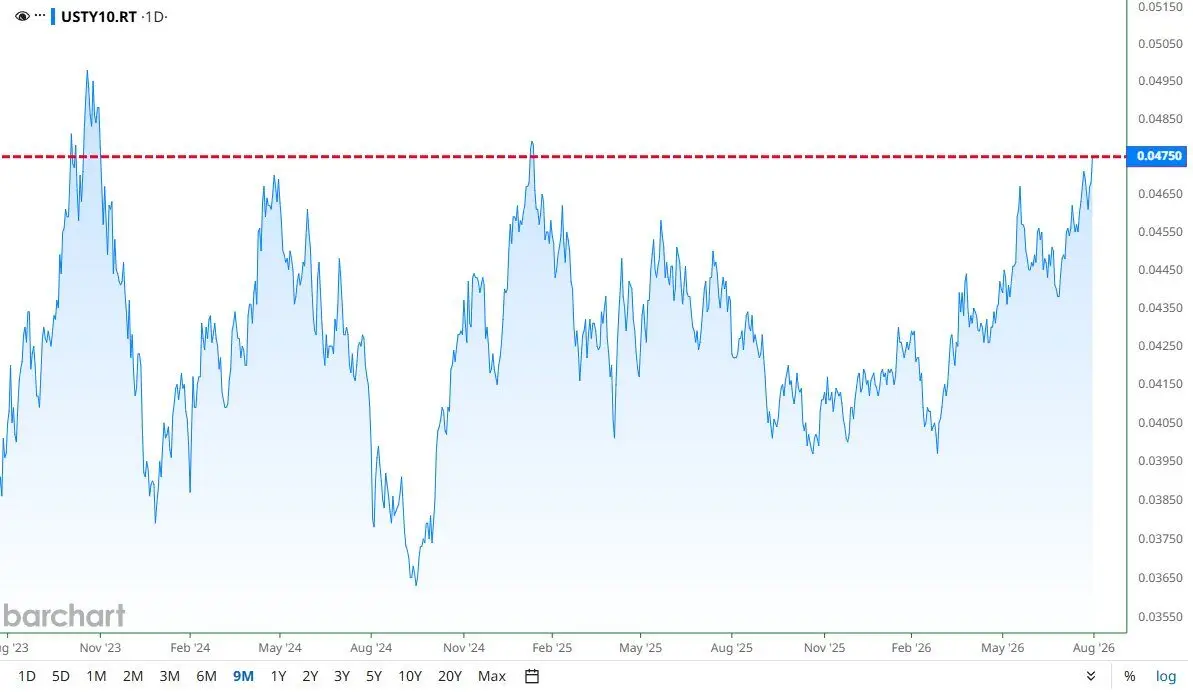
The US 10-year Treasury yield pushed to 4.75% on 31 July 2026, its highest level in 18 months. Our view is that this is not the top – it is the start of a bond-market revolt that will drag equities into a correction and mark the moment Bitcoin builds its cycle low.
The setup: 4.75% and an 18-month high
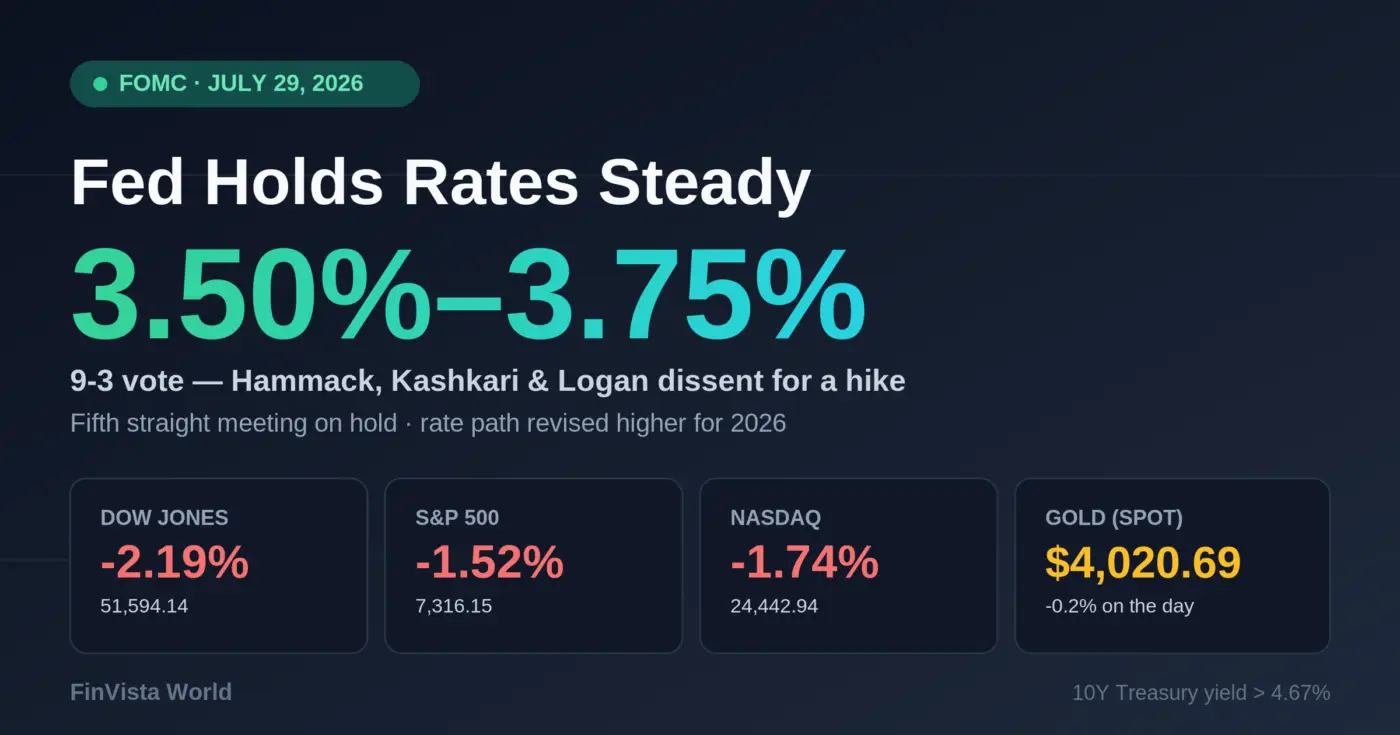
The 10-year note closed at 4.75% on 31 July, a level last seen in January 2025. The 30-year did worse, pushing to roughly 5.23% – its highest since 2007. This came immediately after the FOMC voted 9-3 to hold the federal funds rate at 3.50%-3.75%, with three regional presidents dissenting in favour of a hike.
The short end stayed anchored. The long end did not. That gap is the whole story.
Why we think the bond market is about to revolt
Our view
Bond market likely to revolt and yields head higher with the labor market showing strength recently and the Fed potentially unwilling to raise rates tomorrow. Bond market also revolted in late 2023 which led to a 10% correction in stocks. SPX has had a 10-20% correction starting in Aug/Sep of the last 3 midterm years. This would also align with Bitcoin putting in a market cycle bottom later this year, just when it always does.
That call was written on the eve of the July FOMC. The Fed did hold, and the long end responded exactly as expected – investors dumped 30-year paper rather than celebrating a steady policy rate.
The labour-market argument deserves a caveat we will make ourselves. June non-farm payrolls were soft at 57,000, below the 115,000 consensus. But the unemployment rate fell to 4.2% and initial jobless claims held near 215,000 – there is no wave of layoffs. Economists call this a low-hire, low-fire market. It is not an economy that forces the Fed to cut, and with core PCE still at 3.3%, it is not an economy that lets the Fed ignore inflation either. Bond investors are pricing that squeeze.
The 2023 template: bond revolt first, equity correction second
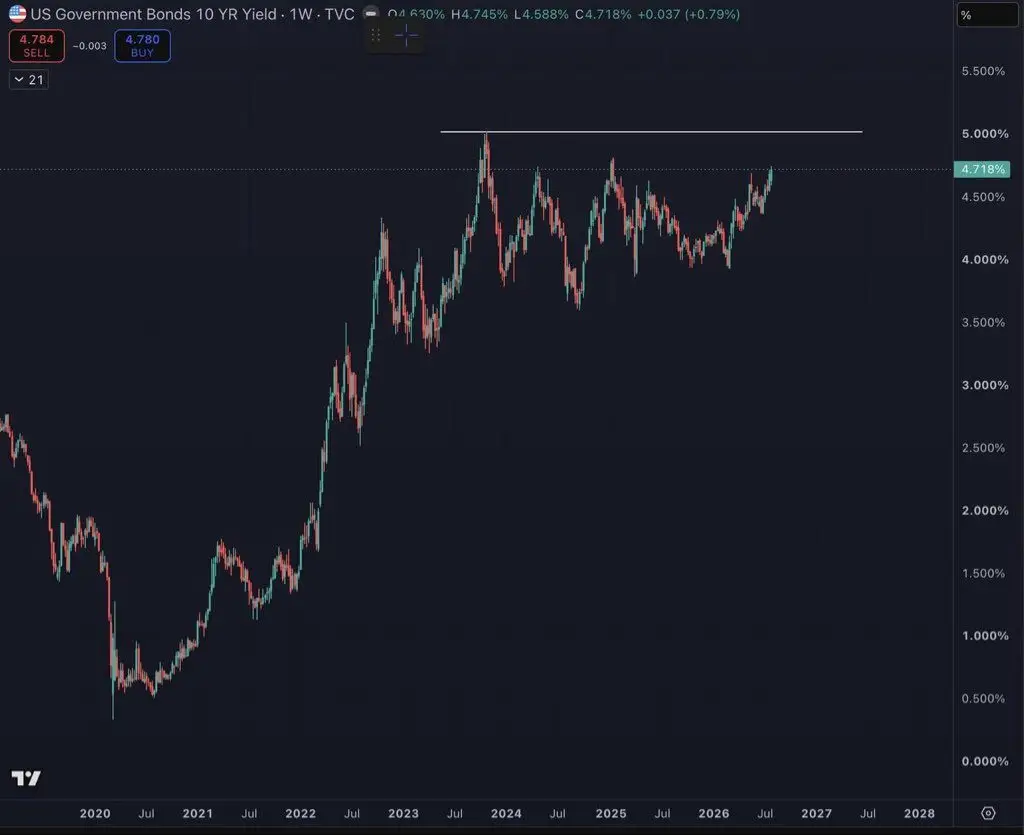
This is not a new pattern. In the autumn of 2023 the same thing happened: the long end sold off hard, the 10-year pushed to 5%, and the S&P 500 delivered a roughly 10% correction before yields peaked and stocks ripped higher into year-end.
The sequencing matters. Equities did not lead. Bonds moved first, equities followed with a lag of several weeks, and the reversal in stocks only came once the yield stopped rising. If that template repeats, the signal to watch is not the S&P – it is the 10-year.
Midterm-year seasonality points to the same window
The calendar agrees. The S&P 500 has dropped into correction territory in August of midterm election years with unusual regularity, and drawdowns of 10-20% beginning in August or September have shown up in each of the last three midterm cycles. 2026 is a midterm year.
The index closed at a record 7,910 on 2 June. Fundstrat’s Tom Lee has flagged a possible 10-20% drawdown between August and October that would “feel like a bear market” before a year-end rally – a view that lines up with our own read of the bond market, even if the reasoning differs.
And that lines up with Bitcoin’s cycle bottom
Our view
With yields heading higher, it coincides with the typical window of weakness for Bitcoin that usually shows up in August/September of midterm years.
Bitcoin peaked at $126,000 in October 2025 and has since lost roughly half its value, printing a 21-month low of $58,000 on 1 July 2026. August is historically Bitcoin’s worst calendar month, with a median loss near 7%.
Analyst projections currently cluster in two places: a shallow bottom of $58,000-$62,000 in early-to-mid August, or a deeper flush to $50,000-$55,000 in the October-December window. We lean toward the later, deeper option – because it is the one that fits the rate path. If the long end keeps rising into a Fed hike, the liquidity squeeze that historically produces the cycle low does not arrive in August. It arrives in Q4.
Where we think rates end up
Our view
The 10Y yield is likely heading back to 5%. Long end rates will likely continue to rise, forcing the Fed to raise rates before the end of the year.
Markets currently price roughly a 63% chance of a September hike. We think the bond market ultimately makes that decision for the Fed rather than the other way round. The 5% level on the 10-year has capped every rally since October 2023; a clean weekly close above it would confirm the regime change and force the front end to follow.
What would prove us wrong
Three things would break this thesis. A genuinely weak July payrolls print on 7 August – not just soft hiring but rising unemployment and claims above 250,000 – would flip the labour argument. A sharp fall in oil would remove the inflation impulse that has driven the term premium since the US-Iran conflict began in late February. And a 10-year that stalls in the 4.75%-4.85% band and rolls over without breaking 5% would simply repeat the 2024 and 2025 failures at the same level, leaving equities free to grind higher.
Market takeaway
Watch the long end, not the Fed. The 10-year at 4.75% and the 30-year at 5.23% are already telling you what bond investors think of a central bank that calls inflation unacceptable and then holds for a fifth meeting. If 5% goes on the 10-year, expect the equity correction to follow within weeks and expect Bitcoin’s cycle low to land in Q4 rather than this month.
This article reflects the opinion of FinVista World and is for informational purposes only. It does not constitute financial or investment advice. Always do your own research before making trading decisions.
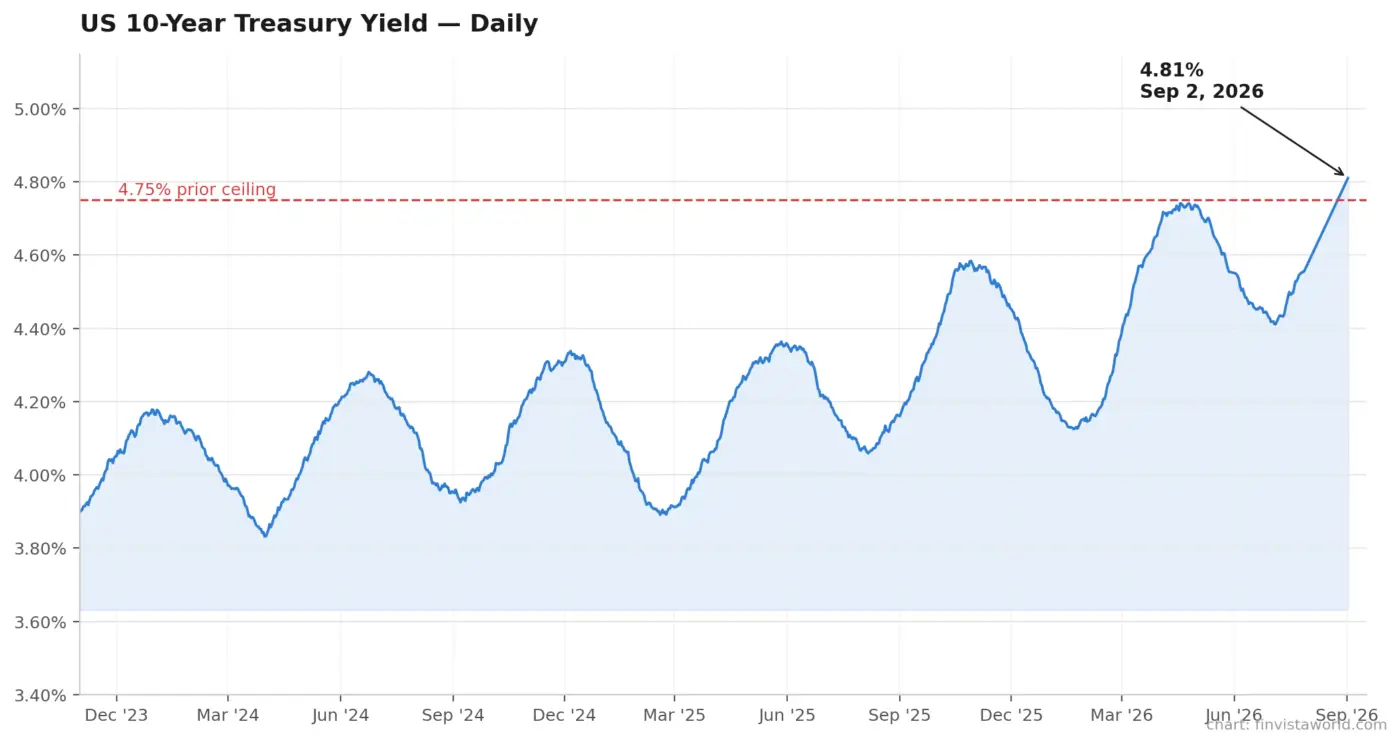 ADP Jobs Miss Collides With Rising Yields: Wall Street Stalls as 10-Year Hits 4.81%
 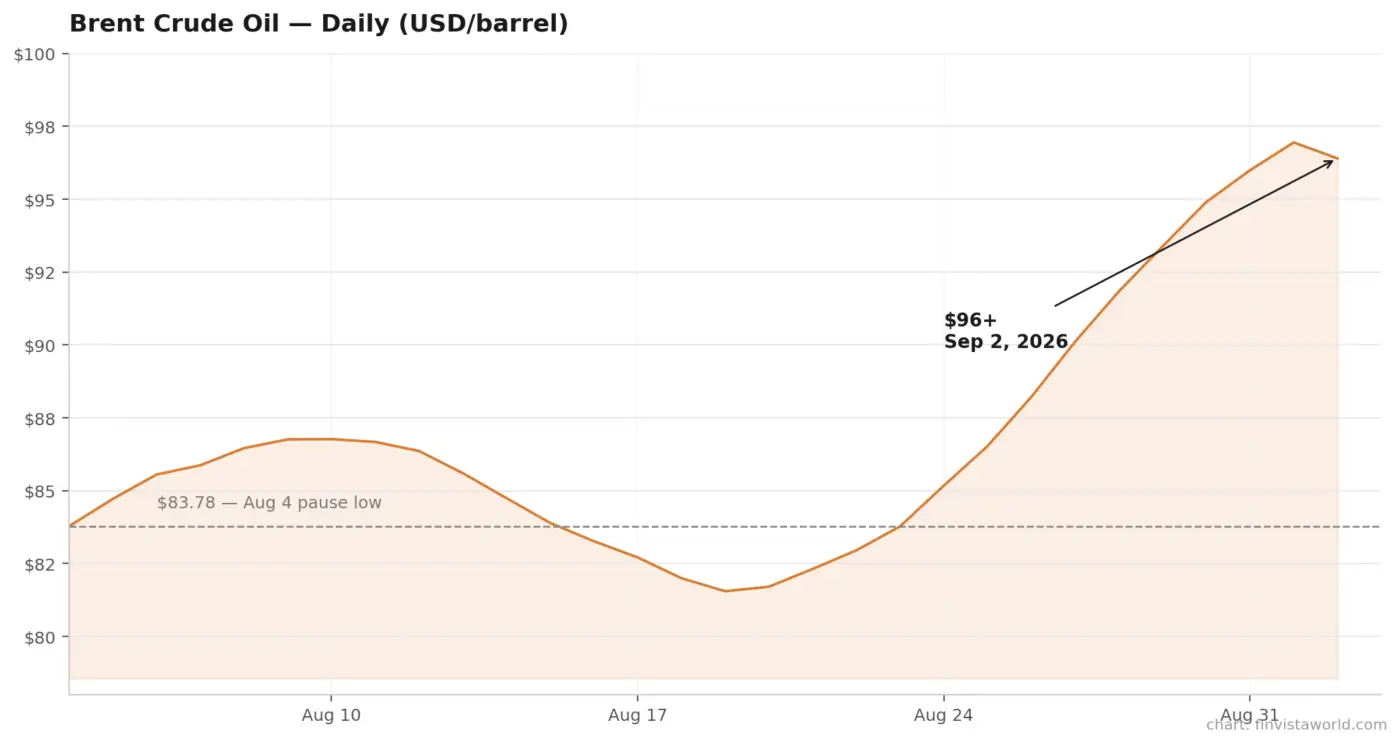 Iran War Reignites: Oil Tops $96, Stocks and Gold Slide Together as Fed Rate-Hike Odds Hit 70%
  Oil Sinks 6%, Dow Hits Record High as Iran Pause Reprices Markets – Crypto Sits It Out
  Bond Market Puts Warsh’s 2% Promise to the Test as 30-Year Yield Hits 19-Year High
  Fed Holds Rates Steady at July 2026 Meeting as Three Officials Dissent, Stocks Tumble
  Canada Keeps AA+ Rating as Fitch Highlights Weak Growth, High Debt and Strong Public Assets