
The AUD/USD pair — nicknamed the “Aussie” — is one of the most important commodity-linked currencies in Forex. In June 2026, the Australian dollar faces a crossroads: Reserve Bank of Australia (RBA) rate expectations, China’s economic trajectory, and global risk sentiment are all converging to create significant trading opportunities. This comprehensive AUD/USD forecast covers fundamentals, technicals, and strategy.

Key Drivers of AUD/USD in 2026
1. Reserve Bank of Australia (RBA) Policy
The RBA has been navigating a delicate balance between stubborn inflation and slowing economic growth. After holding rates steady at 4.35% through Q1 2026, the RBA cut by 25bps in May. Governor Michele Bullock has signaled a data-dependent approach for the rest of 2026. Markets are pricing a total of two cuts by year-end, which could limit AUD upside.
2. China Economic Data
China is Australia’s largest trading partner, absorbing around 35% of Australian exports — primarily iron ore, coal, and LNG. China’s May 2026 Purchasing Managers Index (PMI) came in at 49.8 (below the 50 contraction threshold), adding pressure on the AUD. Any stimulus announcement from Beijing could trigger AUD rallies.
3. Iron Ore & Commodity Prices
Iron ore has stabilized around $115–$120/tonne after a sharp Q1 correction. This level provides moderate support for the AUD. A break below $100/tonne would put significant pressure on Australia’s trade surplus and weaken the currency.

AUD/USD Technical Analysis
| Level | Price | Description |
|---|---|---|
| Major Resistance | 0.6650 | 2026 YTD high, key supply zone |
| Resistance | 0.6580 | 50-day EMA, recent swing high |
| Current Price | 0.6490–0.6540 | Consolidation zone |
| Support | 0.6420 | 200-day MA, previous support |
| Major Support | 0.6350 | Multi-month low, strong demand zone |
The daily chart shows AUD/USD in a descending triangle pattern — a bearish formation that typically resolves to the downside. The RSI at 42 hints at bearish momentum, but not yet oversold. A break below 0.6420 would confirm bearish continuation toward 0.6350.
AUD/USD Outlook: June–July 2026
- Bullish case: China stimulus + iron ore recovery above $130 → AUD/USD targets 0.6580–0.6650
- Bearish case: RBA dovish surprise + China data miss → AUD/USD breaks 0.6400 toward 0.6350
- Base case: Consolidation in 0.6420–0.6580 with downside bias given rate differentials
FAQ — AUD/USD Trading
When is the best time to trade AUD/USD?
The Asian session (11 PM – 8 AM GMT) offers the highest AUD/USD liquidity, particularly around RBA announcements (typically Tuesday mornings AEST). The Sydney–Tokyo overlap produces the tightest spreads.
How does China’s economy affect AUD?
China imports roughly 70% of Australia’s iron ore exports. When China’s manufacturing activity expands (PMI above 50), demand for Australian commodities rises, strengthening the AUD. Weak Chinese data typically pushes AUD/USD lower within hours of release.
Risk Disclaimer: Forex trading carries significant risk. AUD/USD analysis is for informational purposes only. Always apply proper risk management and never invest more than you can afford to lose.
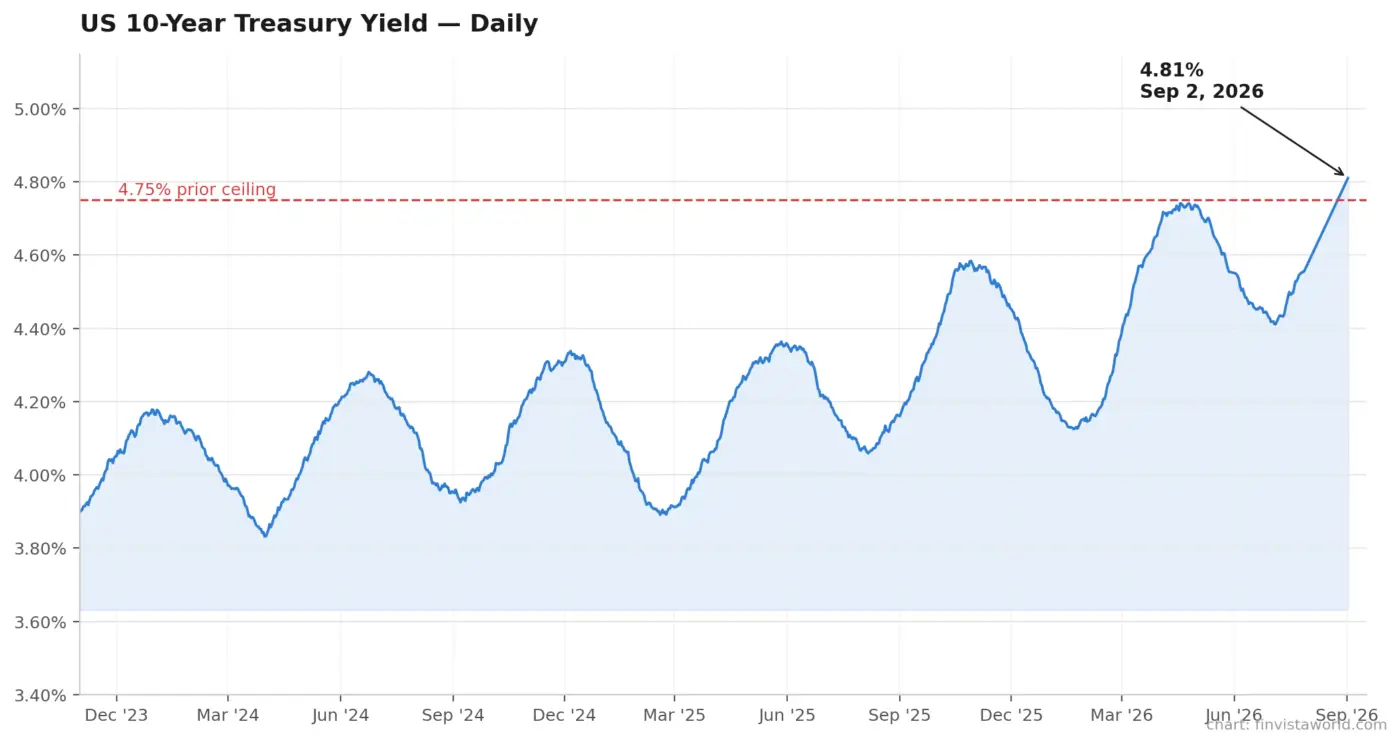 ADP Jobs Miss Collides With Rising Yields: Wall Street Stalls as 10-Year Hits 4.81%
 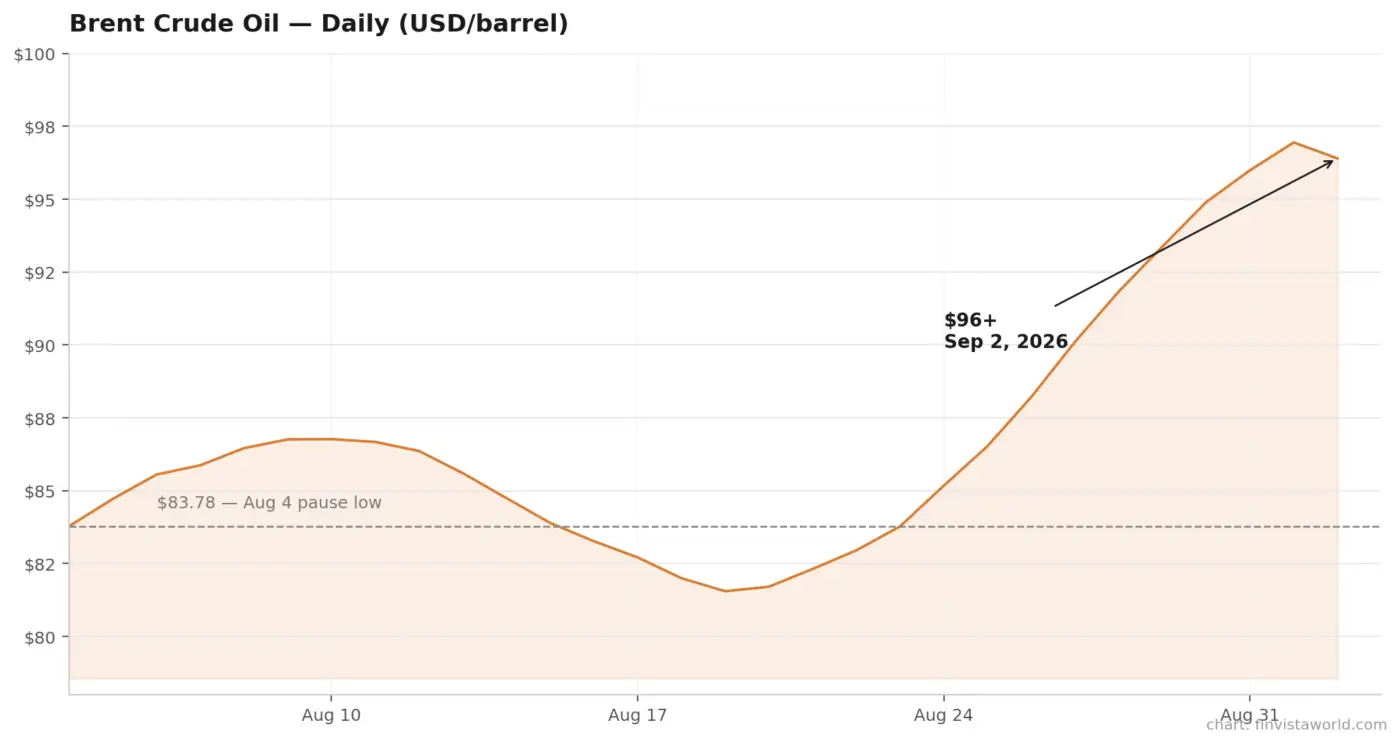 Iran War Reignites: Oil Tops $96, Stocks and Gold Slide Together as Fed Rate-Hike Odds Hit 70%
  Oil Sinks 6%, Dow Hits Record High as Iran Pause Reprices Markets – Crypto Sits It Out
 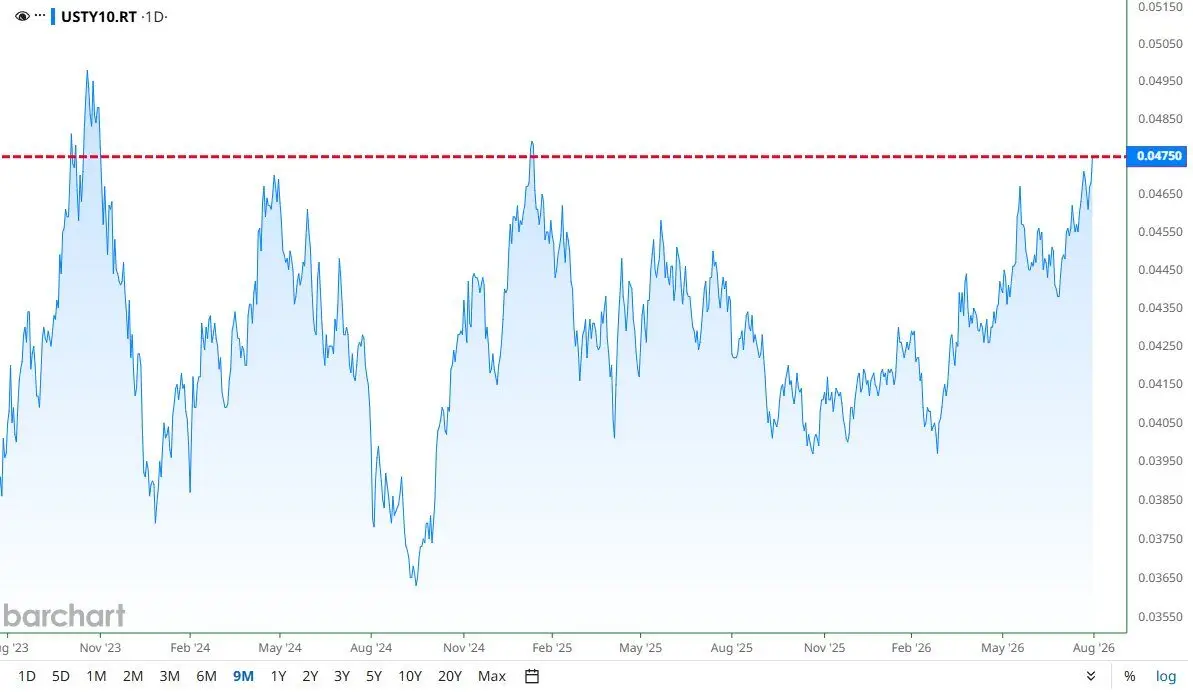 10-Year Yield Hits 4.75%, an 18-Month High – Why the Bond Market Is About to Revolt
  Bond Market Puts Warsh’s 2% Promise to the Test as 30-Year Yield Hits 19-Year High
 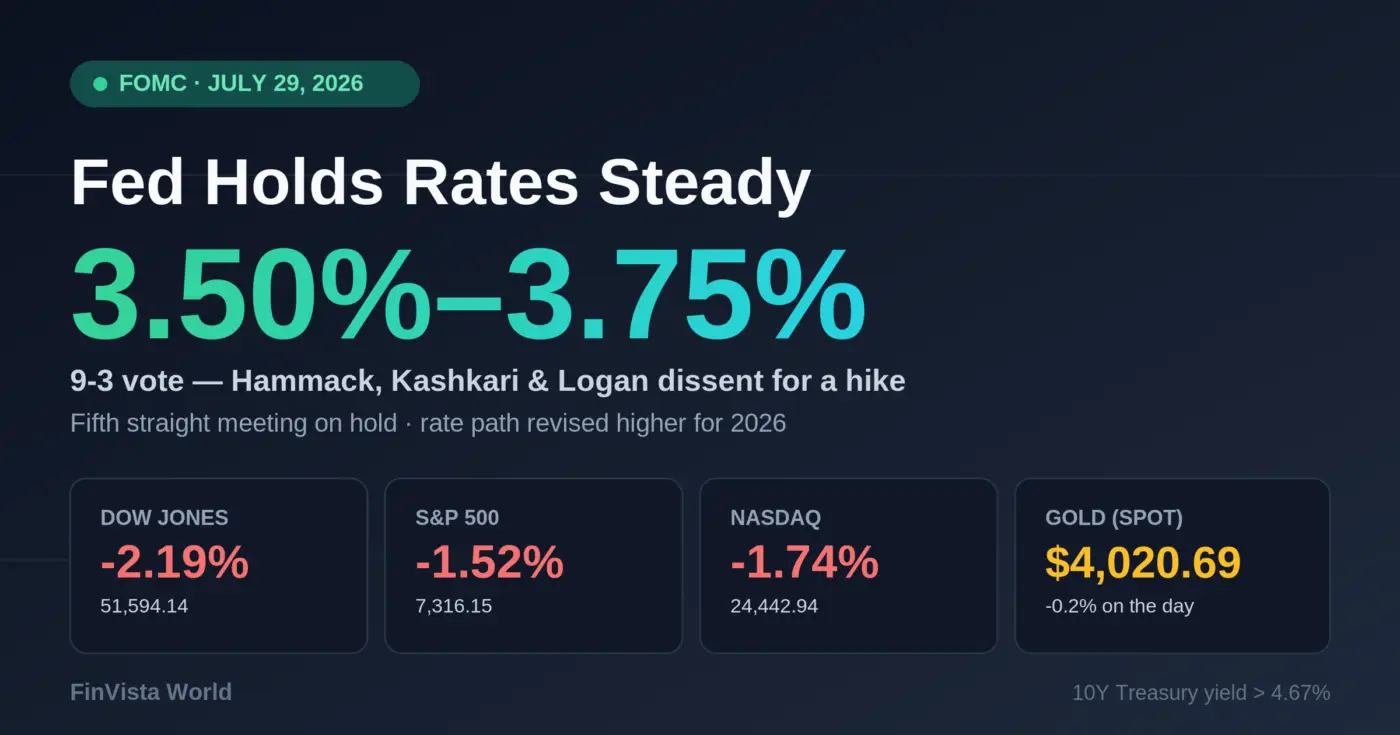 Fed Holds Rates Steady at July 2026 Meeting as Three Officials Dissent, Stocks Tumble