
Bitcoin (BTC) has entered June 2026 from a position of remarkable strength, defying bearish predictions and holding firmly above the six-figure milestone of $105,000. The world’s leading cryptocurrency has now been in a sustained bull cycle for over 18 months since the April 2024 halving, and on-chain data, institutional flows, and macro conditions all continue to support the thesis that this cycle still has room to run. In this comprehensive Bitcoin price analysis, we examine the latest on-chain metrics, ETF demand data, technical chart structure, and what these factors collectively mean for BTC’s price trajectory through Q3 2026.
Bitcoin’s Bull Case: Why $105,000 Is Just a Waypoint

To understand where Bitcoin is heading, it helps to understand where it came from. The April 2024 halving — in which Bitcoin’s block reward was cut from 6.25 BTC to 3.125 BTC — reduced the daily issuance of new coins from approximately 900 BTC to 450 BTC. This supply shock, combined with surging institutional demand driven by the launch of US spot Bitcoin ETFs in January 2024, set the stage for the current bull cycle.
Historically, Bitcoin’s price has reached its cycle peak approximately 12–18 months after each halving. If that historical pattern holds, the current cycle peak would arrive between April and October 2026 — suggesting we may be in the final, often most explosive phase of the bull market.
On-Chain Data: What the Blockchain Tells Us

Exchange Outflows Signal HODLing
One of the most consistently bullish on-chain signals is the continued reduction of Bitcoin held on exchanges. According to Glassnode data, the total BTC balance on centralized exchanges has fallen to 2.1 million BTC — the lowest level since 2018. When coins leave exchanges, it typically signals that holders are moving them to cold storage for long-term holding rather than positioning to sell, which reduces available supply and is generally bullish for price.
MVRV Ratio: Not Yet Overheated
The Market Value to Realized Value (MVRV) ratio compares Bitcoin’s current market cap to its “realized cap” (the aggregate cost basis of all coins). Currently at 2.8, the MVRV suggests the market is profitable but not yet in the euphoric excess that typically precedes a major top. Previous bull market peaks have seen MVRV ratios of 3.7 (2021) and 4.8 (2017). There is meaningful headroom before this metric signals danger.
Long-Term Holder Supply at Record Levels
The percentage of Bitcoin supply held by long-term holders (wallets that have not moved their BTC in more than 155 days) stands at 74% — near a record high. This cohort has historically been the most accurate predictor of bull market continuation: when long-term holders are accumulating rather than distributing, price tends to rise.
Bitcoin Hashrate: Network Security at All-Time High
Bitcoin’s network hashrate — a measure of the total computational power securing the blockchain — has reached an all-time high of 950 exahashes per second (EH/s). This reflects sustained miner confidence in Bitcoin’s long-term value and means the network has never been more secure against attacks.
Institutional Demand: The ETF Revolution Continues

The launch of US spot Bitcoin ETFs in January 2024 fundamentally changed the institutional demand landscape for Bitcoin. As of June 2026, these vehicles have collectively accumulated enormous quantities of BTC:
- BlackRock IBIT: Over 320,000 BTC under management (~$33.6 billion AUM)
- Fidelity FBTC: Over 185,000 BTC (~$19.4 billion AUM)
- Total US ETF BTC holdings: Approximately 960,000 BTC (~$101 billion AUM)
- Global ETF/ETP Bitcoin AUM: Over $120 billion
Critically, these ETFs have recorded 12 consecutive weeks of net inflows as of the latest data — a streak that suggests institutional demand remains robust and shows no signs of reversal. Each week of net inflows means more BTC is being removed from the available supply, reinforcing upward price pressure.
Bitcoin Technical Analysis
Weekly Chart: Uptrend Firmly Intact
On the weekly timeframe, BTC/USD remains in a clear uptrend, with higher highs and higher lows since the October 2023 low near $26,000. The pair is trading comfortably above all major weekly moving averages, and the 20-week SMA (currently near $98,500) has held as support on every meaningful retest.
Daily Chart: Consolidation Above Key Support
On the daily chart, Bitcoin has been consolidating between $100,000 and $112,000 for the past three weeks — a healthy digestion of the earlier 40% surge from $76,000 in March. This type of sideways consolidation after a major move is constructive: it allows the market to absorb profit-taking while new buyers accumulate at range lows.
Key Price Levels
| Level | Price (USD) | Significance |
|---|---|---|
| Cycle ATH | $112,000 | Previous all-time high to beat |
| Current range top | $110,000–$112,000 | Supply zone / distribution area |
| Current price | ~$105,500 | Mid-range consolidation |
| Key support | $100,000 | Major psychological level / demand zone |
| Strong support | $96,500 | 50-day EMA / previous breakout |
| Bull market support | $88,000–$90,000 | 200-day SMA / cycle floor |
Bitcoin Price Forecast Q3 2026
Base case (65% probability): Bitcoin breaks above $112,000 and establishes a new all-time high in Q3/2026. The primary target is $130,000–$135,000, with $150,000 achievable if Fed rate cuts materialize and ETF inflows accelerate further.
Bull case (20% probability): A combination of aggressive Fed easing, a major corporate Bitcoin treasury announcement, or ETF AUM milestone could catalyze a blow-off top toward $180,000–$200,000 by year-end.
Bear case (15% probability): A significant macro shock (recession fears, financial contagion) could trigger a deep correction toward $80,000–$85,000. This would test the bull market thesis but historically would not end the cycle.
Frequently Asked Questions About Bitcoin in 2026
Why is Bitcoin still going up in 2026?
Bitcoin’s continued appreciation is supported by several structural factors: post-halving supply reduction, record institutional demand through ETFs, growing adoption by sovereign wealth funds and corporations, and macroeconomic uncertainty driving demand for hard assets.
Is it too late to buy Bitcoin at $105,000?
This depends entirely on your investment horizon and risk tolerance. If historical halving cycles are a reliable guide, the current price is below the expected cycle peak. However, Bitcoin is highly volatile and a 30–40% correction at any point is always possible. Dollar-cost averaging (DCA) is a commonly recommended approach for new investors.
What would cause Bitcoin to crash from current levels?
Key downside risks include a sudden shift to risk-off sentiment in global markets (triggered by a recession or credit event), unexpected regulatory action targeting ETFs, large-scale exchange hacks, or a sharp reversal in institutional sentiment.
⚠️ Risk Disclaimer: Cryptocurrency investments are highly speculative and volatile. This article is for informational purposes only and does not constitute investment advice. Never invest more than you can afford to lose.
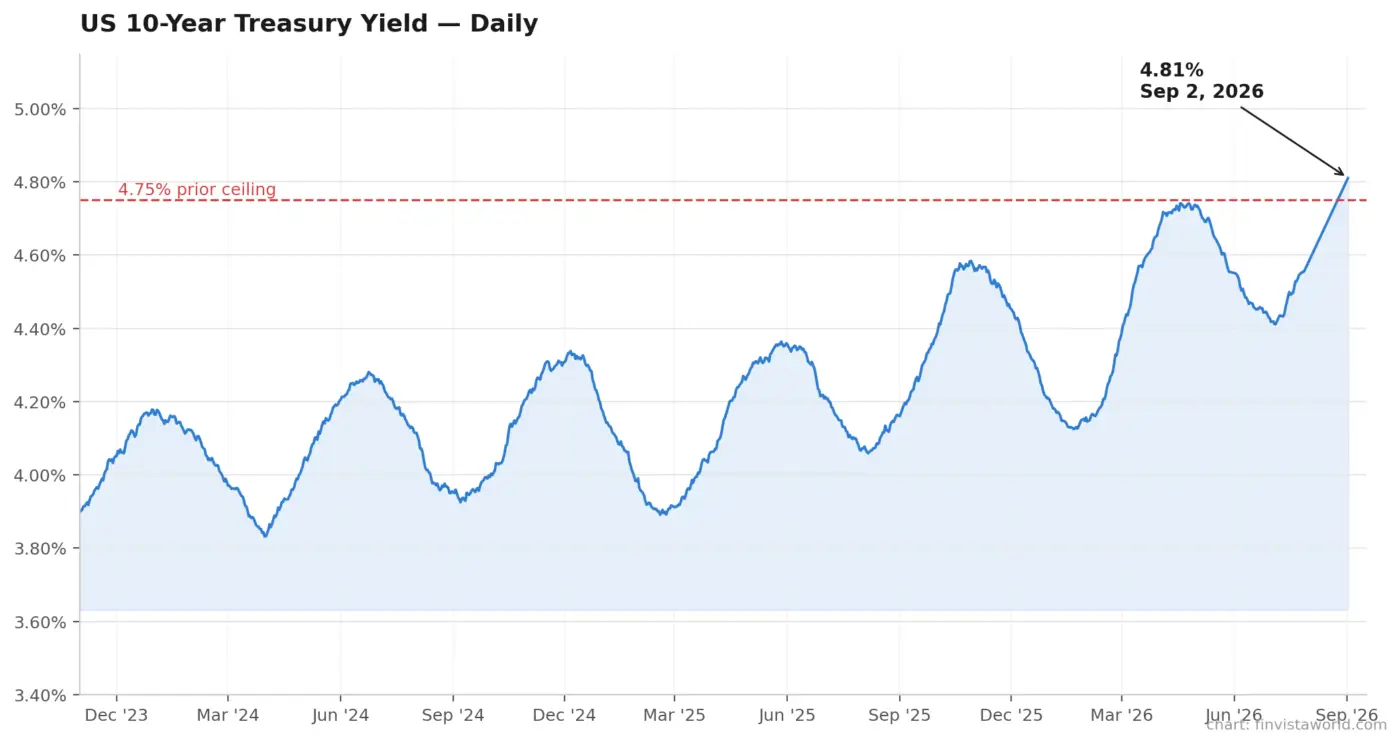 ADP Jobs Miss Collides With Rising Yields: Wall Street Stalls as 10-Year Hits 4.81%
 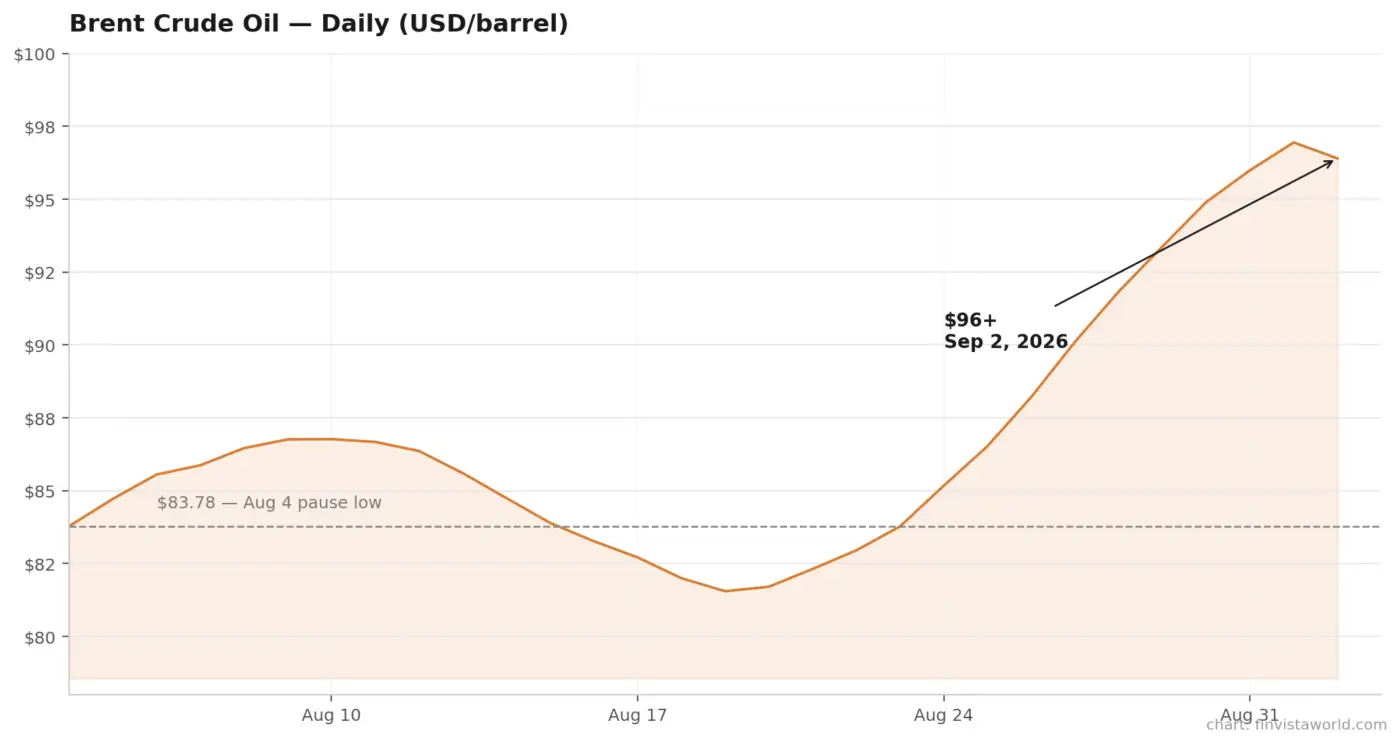 Iran War Reignites: Oil Tops $96, Stocks and Gold Slide Together as Fed Rate-Hike Odds Hit 70%
  Oil Sinks 6%, Dow Hits Record High as Iran Pause Reprices Markets – Crypto Sits It Out
 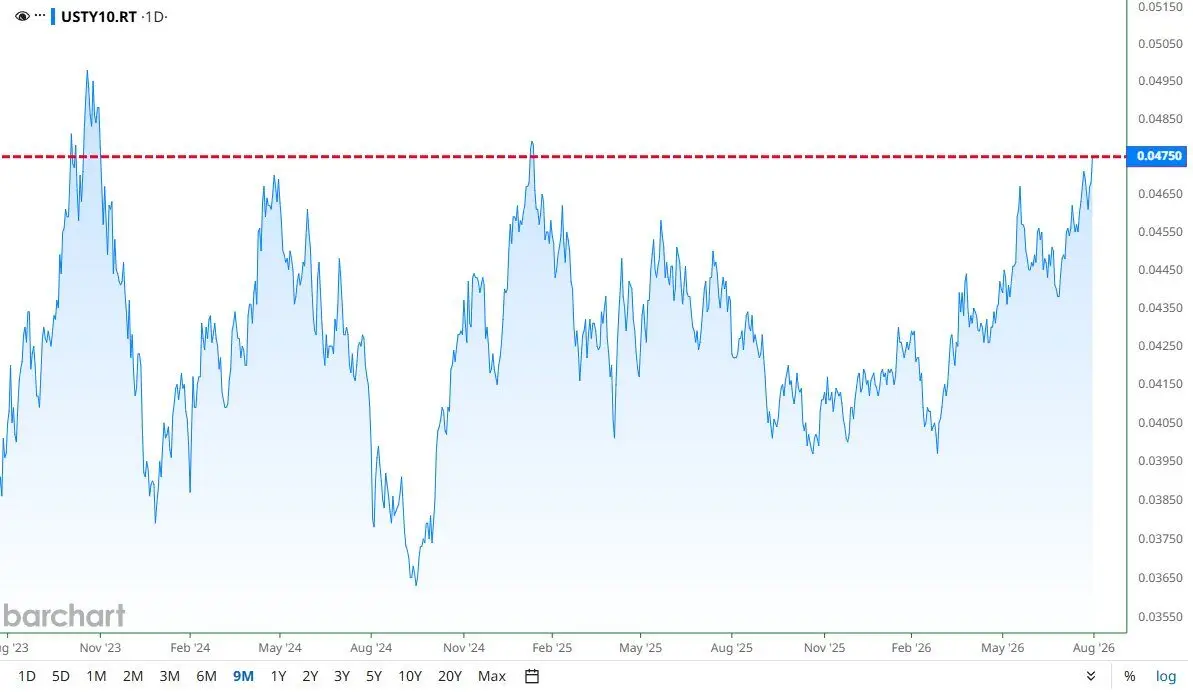 10-Year Yield Hits 4.75%, an 18-Month High – Why the Bond Market Is About to Revolt
  Bond Market Puts Warsh’s 2% Promise to the Test as 30-Year Yield Hits 19-Year High
 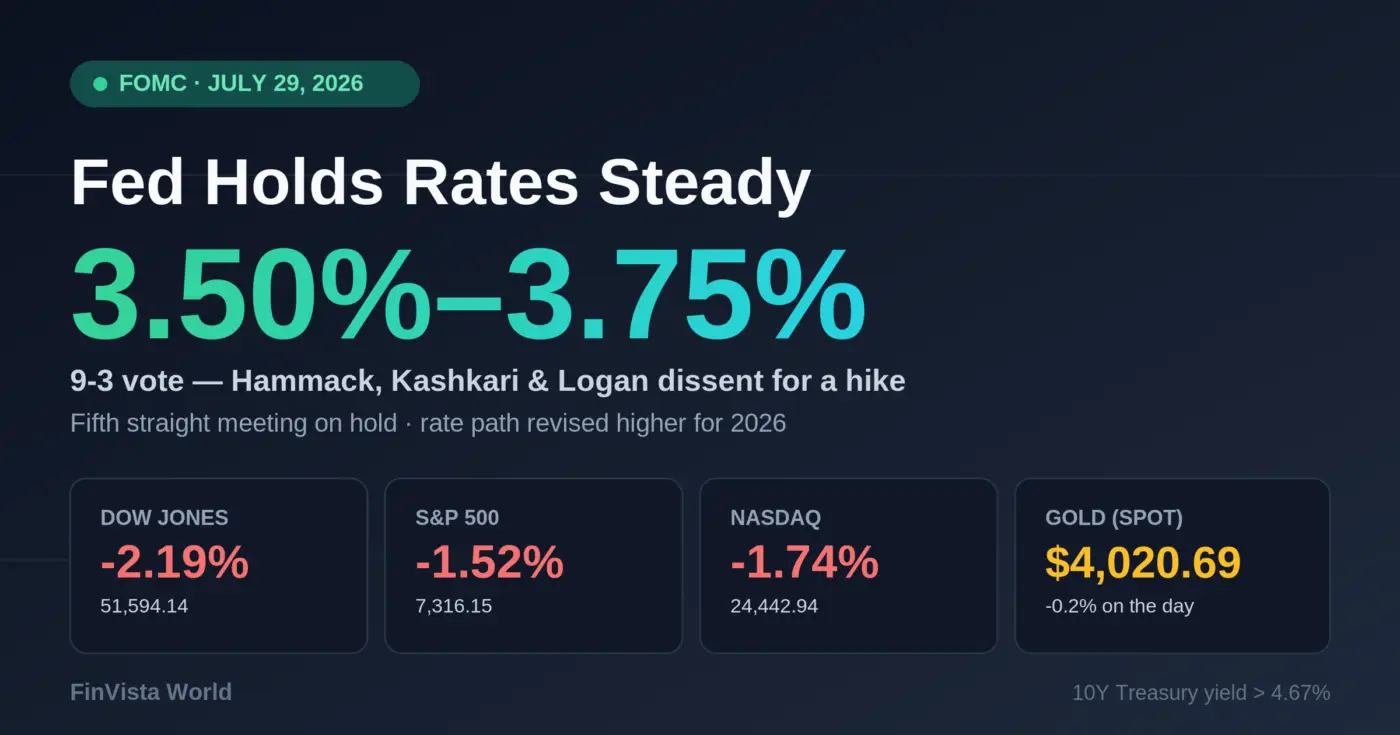 Fed Holds Rates Steady at July 2026 Meeting as Three Officials Dissent, Stocks Tumble