
GBP/USD — the iconic “Cable” — is at a pivotal juncture in June 2026, with the pair having pulled back from its recent high of 1.2980 and now hovering in a technically significant zone around 1.2920–1.2940. The coming week is loaded with high-impact UK economic data and the Bank of England’s June policy decision, which together have the potential to produce a decisive directional move in the pound sterling. In this detailed technical analysis, we examine the key chart patterns, support and resistance levels, momentum indicators, and fundamental catalysts that will determine GBP/USD’s trajectory over the next two to four weeks.
GBP/USD: The Fundamental Backdrop

Before diving into the charts, it is important to understand the fundamental forces acting on the pound. The UK economy is in a complex position: inflation remains stubbornly above the Bank of England’s 2% target (CPI at 3.2% in May, core CPI at 3.5%), but the economy itself is growing at a sluggish pace (GDP +0.3% in Q1/2026), with consumer spending under pressure from elevated mortgage rates.
This creates a genuine dilemma for the BOE: cutting rates would provide relief to mortgage holders and stimulate growth, but risks re-igniting inflation. Maintaining rates helps control prices but risks tipping the economy into a more pronounced slowdown. Markets are currently pricing approximately a 35% probability of a BOE rate cut at the June 13 meeting — a coin-flip that will make this week’s UK data releases particularly market-moving.
GBP/USD Weekly Chart Analysis
Stepping back to the weekly timeframe provides important context. GBP/USD has been in a broad recovery trend since the lows of 1.2040 seen in mid-2024, and the pair remains comfortably above both the 50-week SMA (1.2620) and the 200-week SMA (1.2380). This long-term technical backdrop is constructive for sterling.
The recent pullback from 1.2980 looks corrective rather than trend-reversing on this timeframe, with the pair simply retracing to test a previously broken resistance area around 1.2900 — a classic “throwback” move that often provides a high-quality entry opportunity for trend followers.
GBP/USD Daily Chart Analysis

Price Action and Moving Averages
On the daily chart, GBP/USD has broken below its 20-day SMA at 1.2945, which is a near-term bearish development. The pair is currently testing the 50-day EMA around 1.2920, which is expected to provide initial support. A sustained break below this level would signal increasing bearish momentum and open the path toward the 100-day SMA at 1.2830.
The Bollinger Bands have narrowed significantly over the past five trading sessions, indicating a period of reduced volatility and consolidation. This “squeeze” pattern is often a precursor to an explosive directional move — the question is simply which direction the breakout will take.
Key Support and Resistance Levels
| Level | Price | Technical Significance |
|---|---|---|
| Major resistance | 1.3000 | Psychological level / multi-month high |
| Key resistance | 1.2980 | Recent swing high |
| Minor resistance | 1.2945 | 20-day SMA (broken) |
| Current price | ~1.2925 | 50-day EMA (support) |
| Key support | 1.2880 | Previous breakout zone / 61.8% Fibonacci |
| Strong support | 1.2830 | 100-day SMA |
| Major support | 1.2750 | 200-day SMA |
RSI, MACD, and Stochastic
RSI (14-period): Currently reading 44 on the daily chart — neutral, with a slight bearish lean. There is no divergence signal present that would strongly argue against the current downward pull.
MACD: The MACD line has crossed below the signal line on the daily chart, generating a bearish crossover signal. The histogram is printing negative values and expanding slightly — confirming that near-term downward momentum is building.
Stochastic Oscillator (5,3,3): Stochastic is reading approximately 28 — approaching oversold territory. On shorter timeframes (H4, H1), stochastic is already oversold, which may support a short-term bounce before any continuation of the broader pullback.
GBP/USD H4 Chart — Intraday Structure
On the four-hour chart, GBP/USD formed a bearish flag pattern last week, which broke to the downside on Monday — a textbook continuation signal. The measured move target from this flag projects to approximately 1.2880, which aligns with the key Fibonacci retracement level and previous consolidation zone.
Short-term traders can use the H4 chart to time entries around the 1.2880 support zone, watching for bullish reversal candles (pin bars, engulfing patterns) that might signal a base forming ahead of the BOE decision.
Key Events That Could Move GBP/USD This Week
- Tuesday, June 10: UK Average Earnings (April) — higher wage growth would argue against BOE cuts
- Wednesday, June 11: UK CPI (May) — the single most important data release for GBP this week
- Thursday, June 12: UK GDP (Q1 final) and BOE Monetary Policy Committee meeting — rate decision and vote count will be critical
- Friday, June 13: UK retail sales and consumer confidence data
Trading Strategy and Scenarios

Scenario 1 — BOE holds and sounds hawkish (GBP bullish): If CPI comes in above expectations and the BOE votes 7-2 or 8-1 to hold rates, GBP/USD could reverse sharply back above 1.2980 and challenge the 1.3000 level. Traders could look to buy on any dip toward 1.2880 ahead of the data.
Scenario 2 — BOE cuts rates or sounds dovish (GBP bearish): A surprise rate cut or a large majority voting for cuts would likely push GBP/USD below 1.2830, potentially targeting the 200-day SMA at 1.2750. Short entries on a break of 1.2870 offer a favorable risk-reward setup.
Scenario 3 — Mixed signals (consolidation continues): If data and BOE communication are ambiguous, GBP/USD is likely to remain range-bound between 1.2880 and 1.2980, requiring range trading strategies rather than breakout plays.
Frequently Asked Questions
Why is GBP/USD called “Cable”?
The nickname “Cable” dates back to the mid-19th century when the GBP/USD exchange rate was transmitted between London and New York via a transatlantic telegraph cable — one of the great technological achievements of the era. The name has stuck ever since.
What is the strongest support level for GBP/USD right now?
The most structurally significant support zone is 1.2830–1.2880, which represents a confluence of the 100-day SMA, the 61.8% Fibonacci retracement of the latest swing up, and a previous breakout area. A daily close below 1.2830 would be a significant bearish signal.
Is GBP/USD a good pair to trade?
GBP/USD is an excellent pair for experienced traders who enjoy higher volatility and larger intraday ranges. However, its sensitivity to UK-specific news events means it can produce sharp, sudden moves that require robust risk management.
⚠️ Risk Disclaimer: Technical analysis does not guarantee future price movements. Forex trading carries substantial risk of loss. This content is for educational purposes only and should not be interpreted as financial advice.
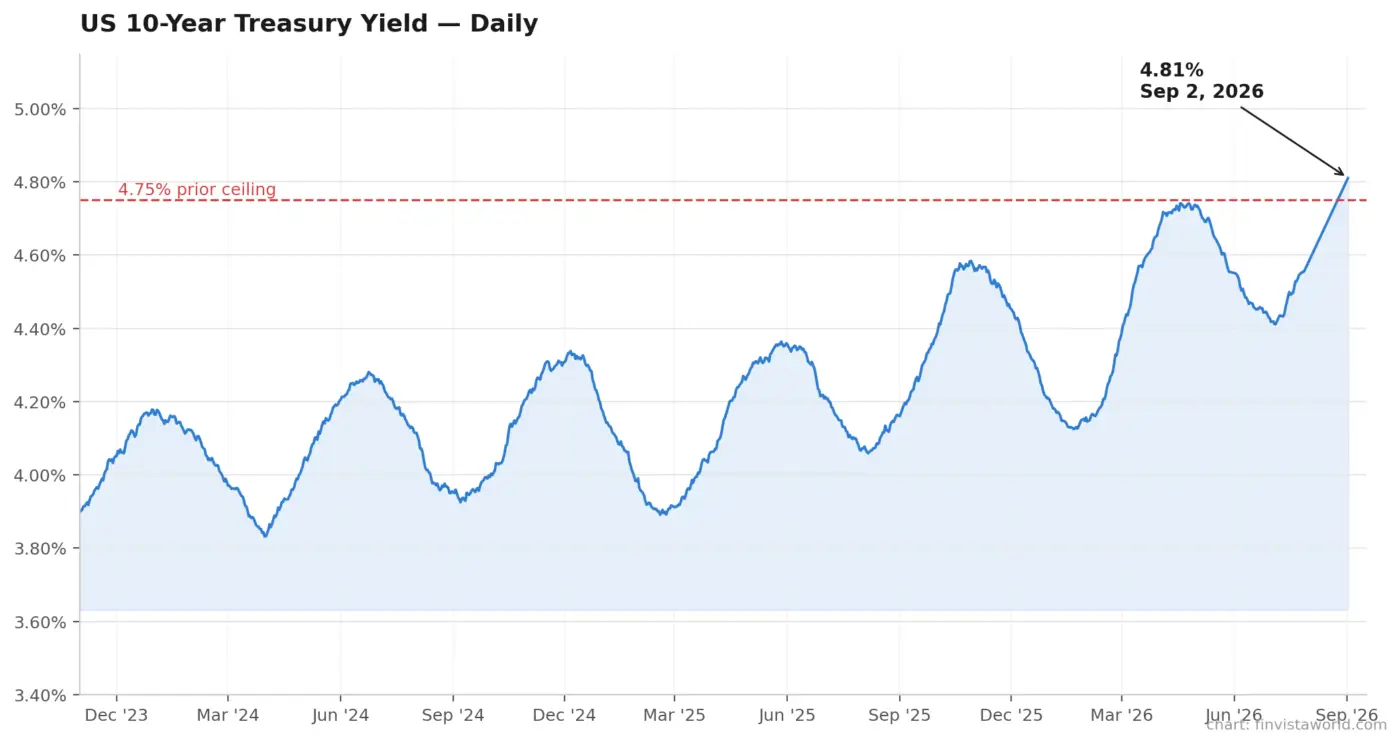 ADP Jobs Miss Collides With Rising Yields: Wall Street Stalls as 10-Year Hits 4.81%
 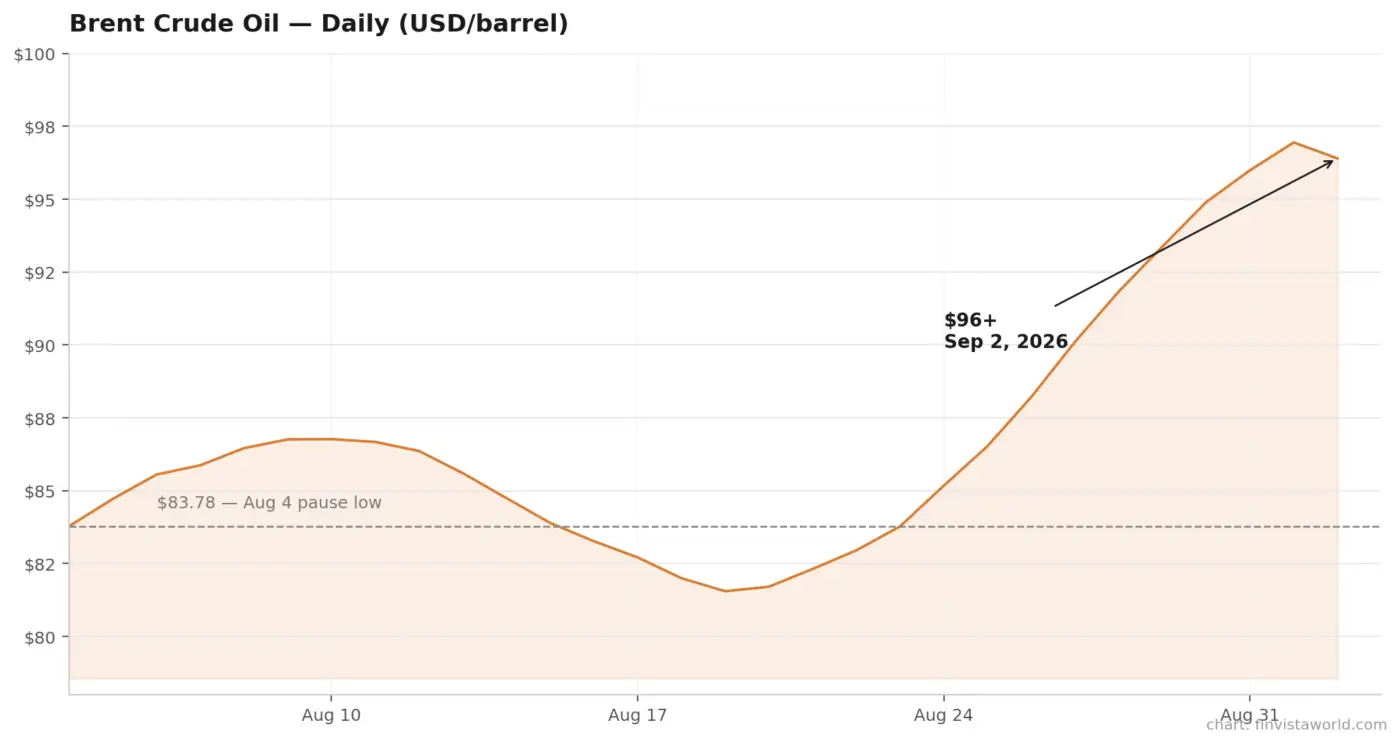 Iran War Reignites: Oil Tops $96, Stocks and Gold Slide Together as Fed Rate-Hike Odds Hit 70%
  Oil Sinks 6%, Dow Hits Record High as Iran Pause Reprices Markets – Crypto Sits It Out
 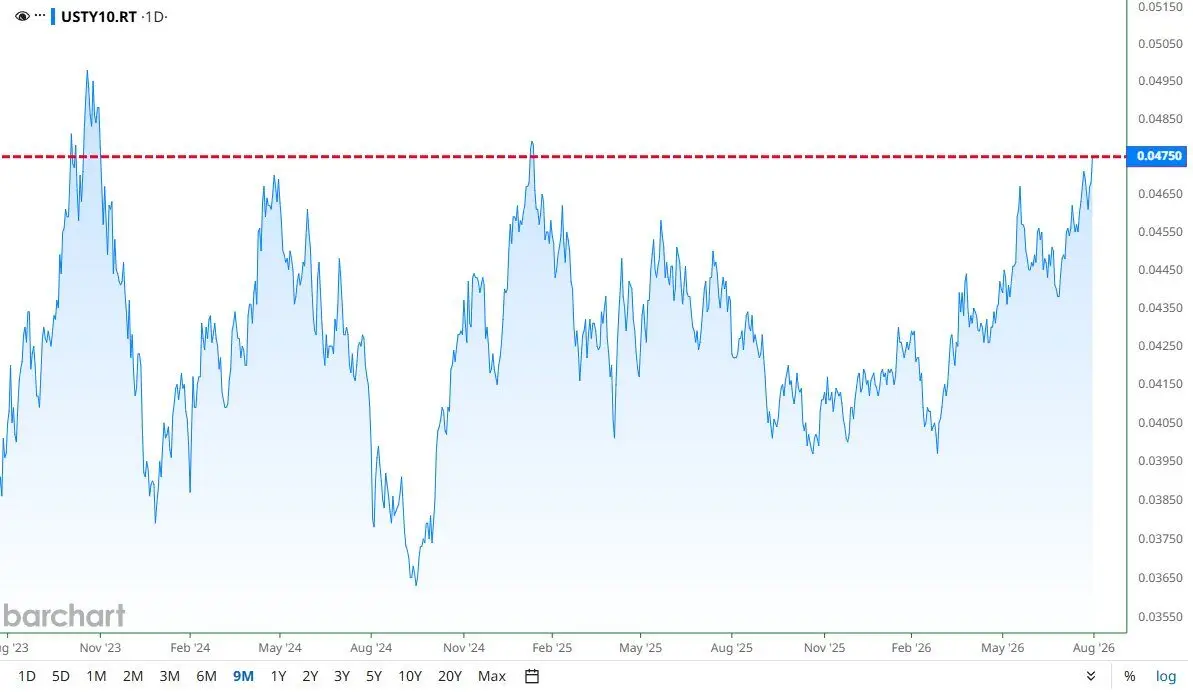 10-Year Yield Hits 4.75%, an 18-Month High – Why the Bond Market Is About to Revolt
  Bond Market Puts Warsh’s 2% Promise to the Test as 30-Year Yield Hits 19-Year High
 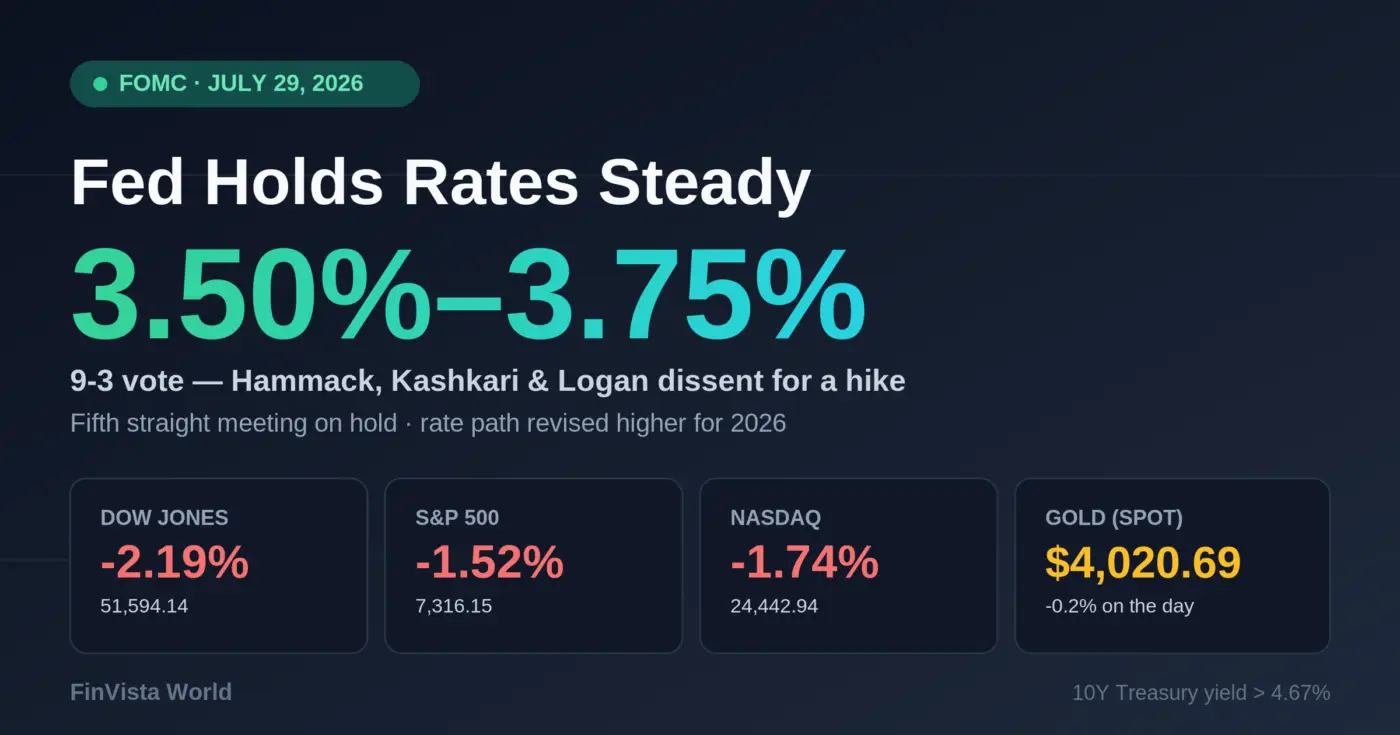 Fed Holds Rates Steady at July 2026 Meeting as Three Officials Dissent, Stocks Tumble