
Gold has staged an impressive recovery in early June 2026, clawing back above the $3,200 per ounce level after a sharp correction from its all-time high of $3,385 set in early May. The precious metal is benefiting from a confluence of bullish drivers — escalating geopolitical tensions, persistent central bank demand, and growing expectations that the Federal Reserve’s rate-hiking cycle is truly over. For traders and investors, the critical question is whether this rebound is a sustainable upswing or merely a dead-cat bounce before another leg lower. In this comprehensive analysis, we examine the fundamental and technical forces at play, and outline what gold could realistically achieve in the months ahead.
What’s Driving Gold Higher in June 2026?
1. Geopolitical Risk Premium Returns
After a period of relative calm, geopolitical tensions in the Middle East have re-escalated significantly, driving fresh safe-haven demand for gold. Renewed hostilities in the region — combined with ongoing uncertainty around the Russia-Ukraine conflict and rising US-China tensions over Taiwan — have pushed investors back toward traditional safe-haven assets including gold, the Swiss franc, and US Treasuries.
Historically, sustained geopolitical uncertainty has been one of the most reliable bullish catalysts for gold, as it undermines confidence in paper assets and drives demand for stores of value with no counterparty risk.
2. Central Bank Buying at Record Levels
One of the most structurally important trends supporting gold is the continued accumulation of gold reserves by central banks worldwide. According to data from the World Gold Council, central banks purchased a combined 290 tonnes of gold in Q1/2026 — the highest quarterly figure on record. Leading buyers include central banks from China, Turkey, India, Poland, and several Gulf states, all of which are diversifying away from US dollar reserves.
This institutional demand acts as a powerful price floor, absorbing selling pressure and preventing deeper corrections.
3. Federal Reserve Rate Cut Expectations
While the Fed has maintained a hawkish posture publicly, futures markets are pricing in at least one 25-basis-point rate cut before year-end 2026. Lower interest rates reduce the opportunity cost of holding non-yielding gold and weaken the US dollar — both of which are historically bullish for gold prices. Any data pointing to a US economic slowdown or further disinflation could accelerate the rate cut timeline and provide a significant additional boost to gold.
4. ETF Demand Stabilizing
After months of consistent outflows, gold-backed ETFs have begun to see net inflows again. Global gold ETF holdings increased by approximately 34 tonnes in May 2026 — the first meaningful monthly net addition since early 2025. This return of Western investor demand through ETFs adds to the already robust physical and central bank buying.
Technical Analysis: XAU/USD Chart Breakdown
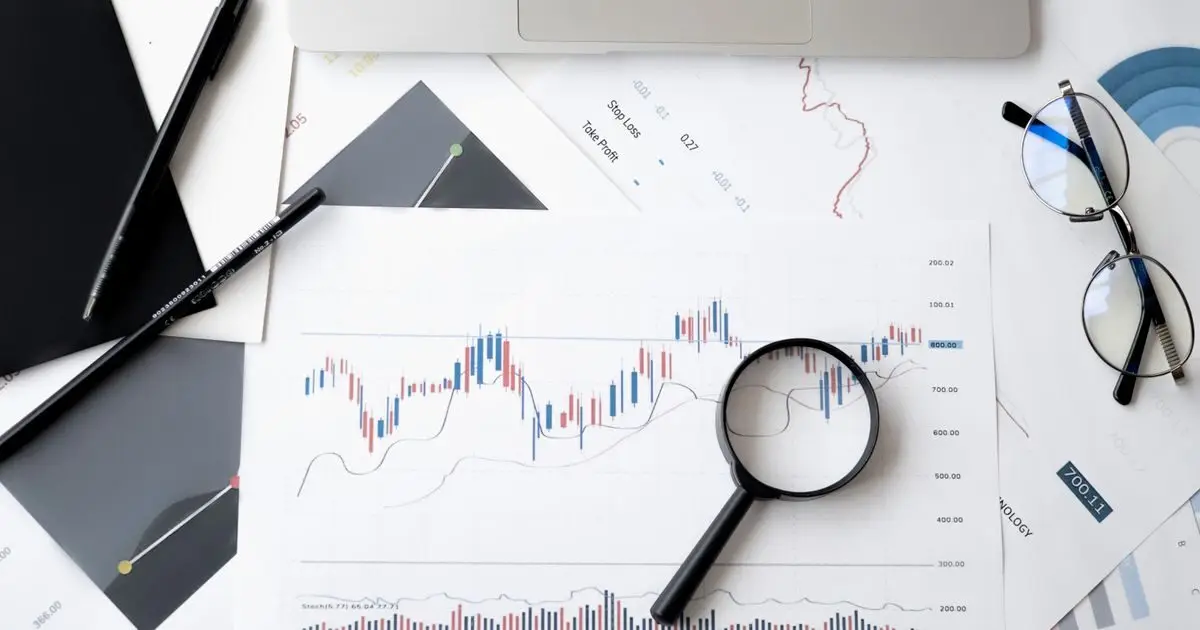
Daily Chart Overview
On the daily chart, gold has formed a clear “double bottom” pattern between $3,140 and $3,155, providing strong technical evidence that the corrective phase from the $3,385 high may be complete. The pair has since broken above the neckline of the pattern near $3,190 and is now testing the $3,215–$3,230 resistance zone.
Key moving averages are turning supportive: the 20-day SMA has flattened near $3,175, while the longer-term 100-day SMA sits near $3,100 — both providing dynamic support for bullish positioning.
Key Levels to Watch
| Level | Price (USD) | Role |
|---|---|---|
| All-time high | $3,385 | Ultimate bull target |
| Key resistance | $3,280–$3,300 | Previous consolidation zone |
| Immediate resistance | $3,230–$3,250 | Current week high |
| Current price | ~$3,215 | Recovery zone |
| Key support | $3,175–$3,190 | Double bottom neckline |
| Strong support | $3,140–$3,155 | Double bottom low |
| Major support | $3,050 | 100-day SMA / critical floor |
RSI and Momentum
The RSI on the daily chart has recovered from oversold levels near 28 (reached during the correction) to a current reading of approximately 52 — neutral territory. This suggests the immediate selling pressure has been absorbed without the rally becoming overextended. There is meaningful room for further upside before RSI signals overbought conditions.
Gold Outlook: Price Targets and Scenarios
Bullish scenario (60% probability): Gold holds above $3,175 and builds a base for a move toward $3,280–$3,300. A break above $3,300 would signal resumption of the primary uptrend, with the all-time high of $3,385 back in sight. Catalysts: Fed dovish pivot, escalation of geopolitical conflicts, continued central bank buying.
Neutral scenario (25% probability): Gold consolidates between $3,150 and $3,260 for several weeks, digesting the recent correction before the next directional move. This would be consistent with a healthy bull market pause.
Bearish scenario (15% probability): A break below $3,140 would invalidate the double bottom and could trigger a deeper pullback toward $3,050–$3,000. This scenario would likely require unexpectedly hawkish Fed communication or a sharp risk-on rally in equities.
How to Trade Gold in the Current Environment
For swing traders, the $3,175–$3,190 zone offers a compelling buy-on-dips area with a defined risk level (stop loss below $3,140). Longer-term investors may consider building positions in the $3,150–$3,200 range with a 3–6 month horizon targeting $3,350+.
Options traders can consider buying gold call options with a strike around $3,300 for Q3 expiry as a leveraged way to express a bullish view with defined risk.
Frequently Asked Questions About Gold in 2026
Why is gold rising in 2026?
Gold is rising due to a combination of central bank demand at record levels, geopolitical risk premiums, weakening US dollar expectations, and ETF inflow recovery. These structural and cyclical factors create a favorable environment for the precious metal.
Is gold a good investment in 2026?
Gold has historically served as an effective portfolio diversifier and inflation hedge. Its strong performance in 2025–2026 reflects genuine fundamental demand. However, it is a volatile asset and should be sized appropriately within any investment portfolio.
What is the gold price target for 2026?
Major investment banks including Goldman Sachs, JPMorgan, and UBS have published 12-month gold price targets ranging from $3,300 to $3,700 per ounce for 2026, depending on assumptions about Fed policy and geopolitical developments.
⚠️ Risk Disclaimer: Gold and commodity trading involves significant risk. This article is for educational and informational purposes only and does not constitute investment advice. Past performance is not a guarantee of future results.
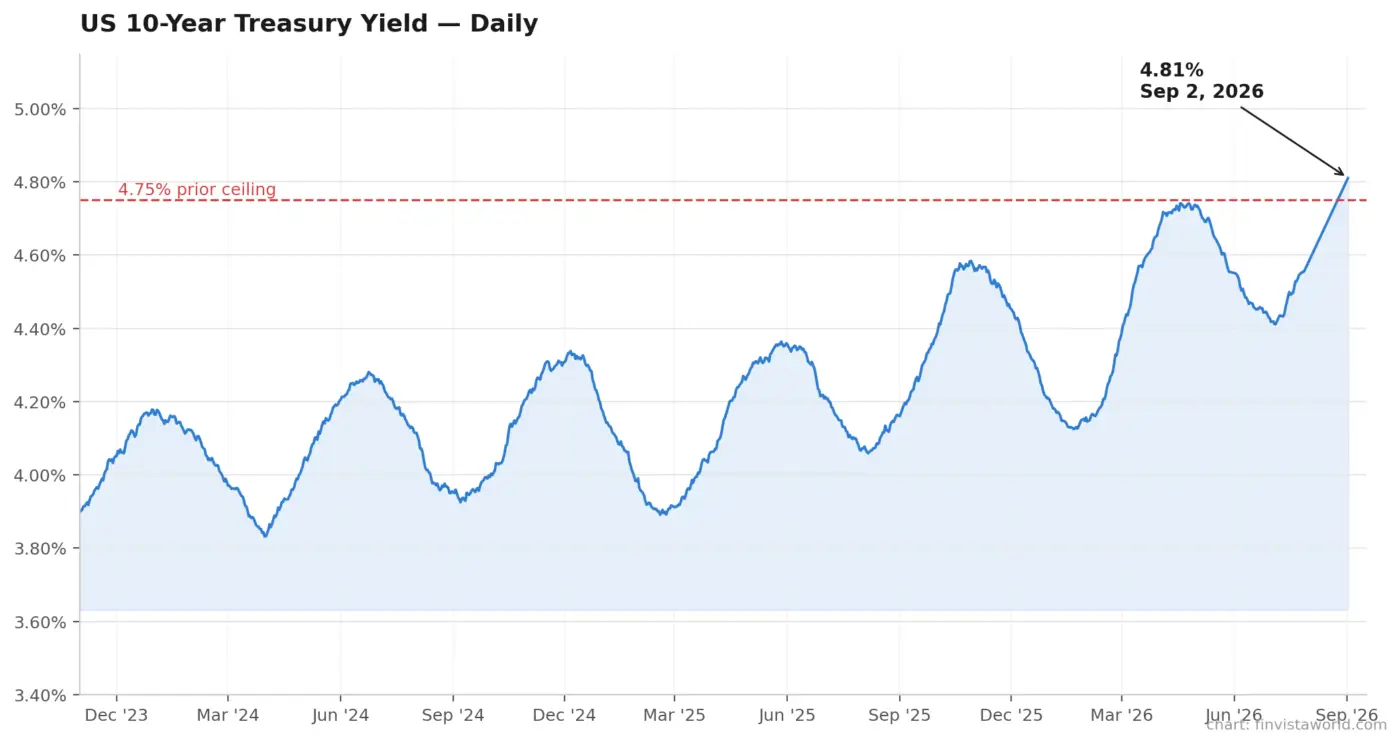 ADP Jobs Miss Collides With Rising Yields: Wall Street Stalls as 10-Year Hits 4.81%
 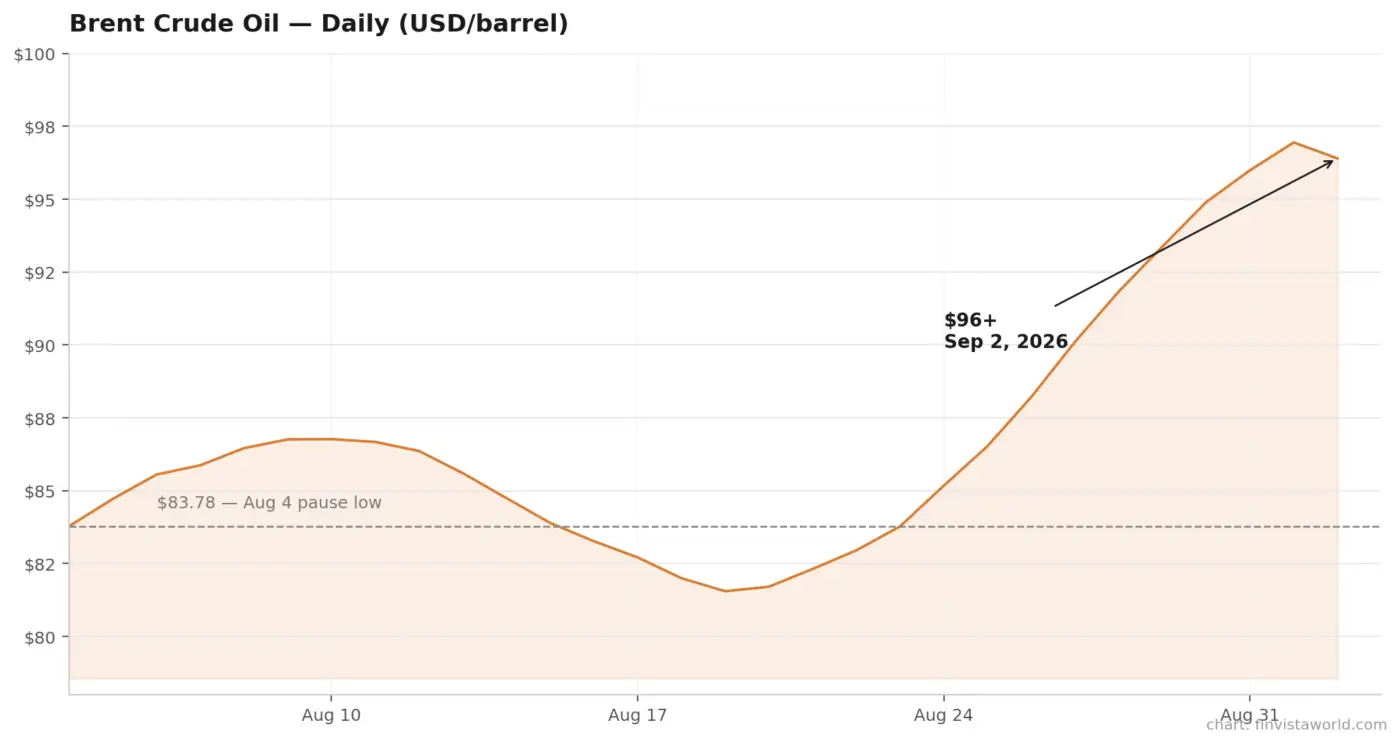 Iran War Reignites: Oil Tops $96, Stocks and Gold Slide Together as Fed Rate-Hike Odds Hit 70%
  Oil Sinks 6%, Dow Hits Record High as Iran Pause Reprices Markets – Crypto Sits It Out
 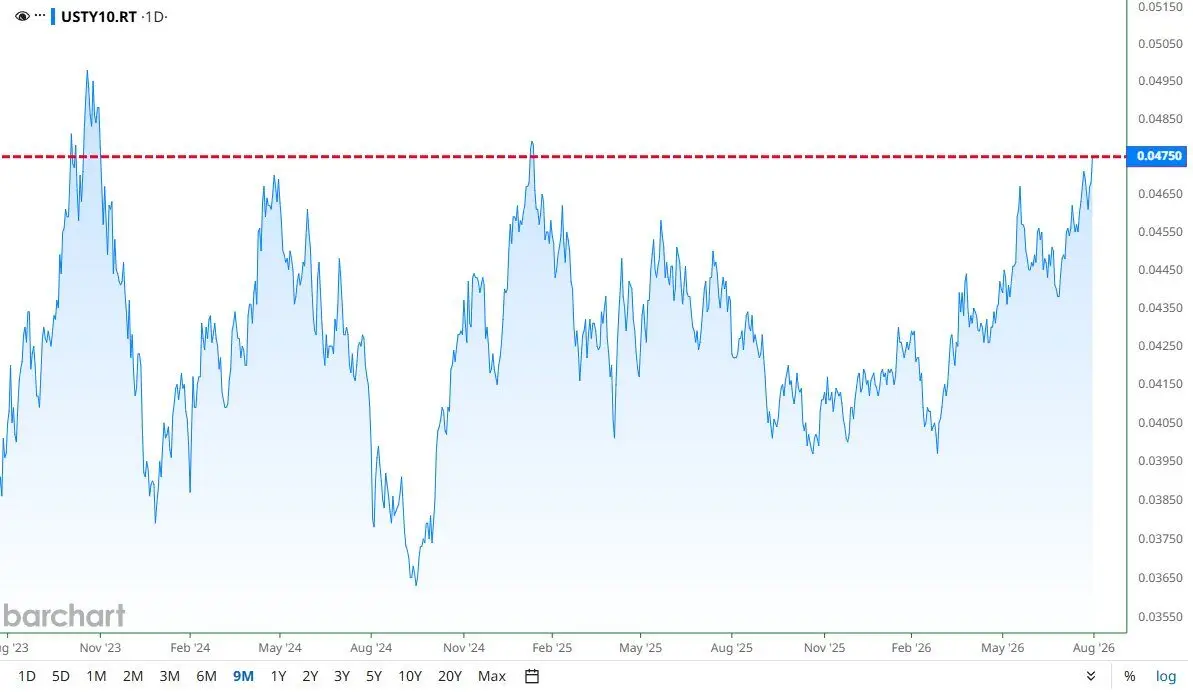 10-Year Yield Hits 4.75%, an 18-Month High – Why the Bond Market Is About to Revolt
  Bond Market Puts Warsh’s 2% Promise to the Test as 30-Year Yield Hits 19-Year High
 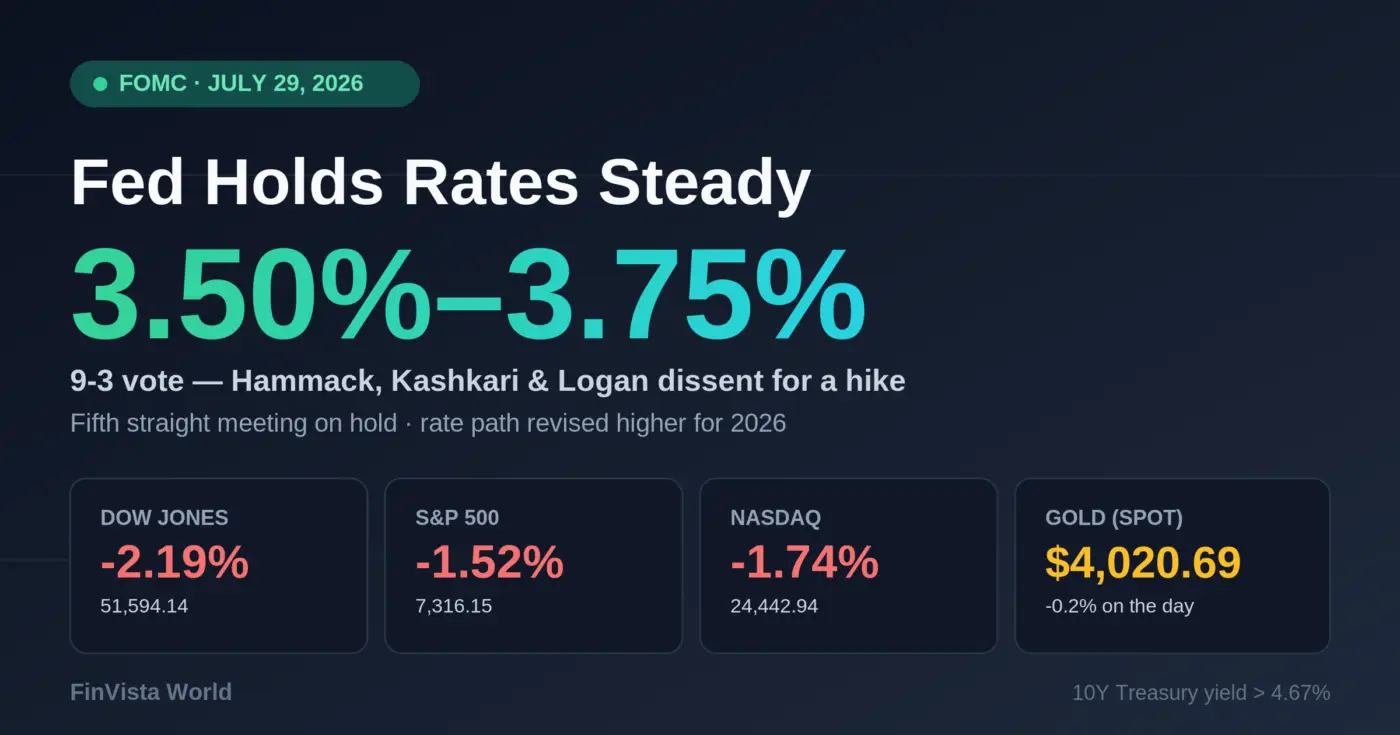 Fed Holds Rates Steady at July 2026 Meeting as Three Officials Dissent, Stocks Tumble