
Among the dozens of trading methodologies available to binary options traders, price action stands out as the most enduring, most versatile, and — in the hands of a disciplined practitioner — most effective approach. Unlike indicator-based systems that rely on lagging mathematical formulas derived from past price data, pure price action trading reads the market directly through the raw movement of price itself. It requires no RSI, no MACD, no Bollinger Bands — just a clean chart, a solid understanding of market structure, and the patience to wait for high-probability setups. This comprehensive guide explains exactly what price action is, why it works particularly well for binary options, and how to build a complete trading system around the three most powerful price action patterns available to retail traders.
Why Price Action Works for Binary Options

Binary options present a specific challenge that most trading methodologies are not designed to handle: you must be right about direction within a very specific, short time window. A trade that is fundamentally correct but arrives three minutes too late is just as much a loss as one that is completely wrong. This time-sensitivity makes indicator-based systems particularly problematic for binary options, because indicators have inherent lag — they are calculated from historical price data and therefore react to market moves rather than anticipating them.
Price action, by contrast, gives you real-time information about the balance of power between buyers and sellers at any given moment. A pin bar forming at a key resistance level tells you right now that sellers are overwhelming buyers at that price — before any indicator has had time to process and display that information. This immediacy is invaluable for binary options traders who need to time entries with precision.
Additionally, price action patterns work on any timeframe and any asset, making them extraordinarily versatile for binary options traders who may want to trade EUR/USD, Gold, Bitcoin, or the S&P 500 using the same core analytical framework.
Understanding Market Structure: The Foundation of Price Action
Before learning specific candlestick patterns, every price action trader must master market structure — the framework that tells you whether the market is trending up, trending down, or moving sideways. Trading patterns in the direction of the prevailing market structure dramatically improves your win rate compared to randomly entering trades regardless of context.
Uptrend Structure
A market is in an uptrend when it is consistently making higher highs (HH) and higher lows (HL). In an uptrend, price action traders look for CALL options — buying dips to support levels and looking for bullish reversal signals that confirm the uptrend is resuming.
Downtrend Structure
A downtrend is defined by lower lows (LL) and lower highs (LH). In a downtrend, traders look for PUT options — selling rallies to resistance levels and looking for bearish reversal signals that confirm the selling pressure is resuming.
Ranging/Sideways Markets
When the market is moving sideways within a defined range, traders can play both ends — CALL at range support, PUT at range resistance. Binary options are particularly well-suited to ranging markets because the outcome is binary (will price reach the resistance or stay below it?) and the risk is clearly defined.
The Three Most Powerful Price Action Patterns for Binary Options

Pattern 1: The Pin Bar (Hammer and Shooting Star)
The pin bar is perhaps the single most reliable reversal signal in all of technical analysis. A pin bar is a candlestick characterized by a small body and a long wick (shadow) — at least two-thirds of the total candle length — on one end. The long wick represents price that was forcefully rejected: buyers or sellers attempted to push price in one direction but were overwhelmed by the opposing force, leaving behind a “pin” that marks the rejection point.
Bullish pin bar characteristics:
- Long lower wick (at least 2x the body length)
- Small body positioned in the upper third of the total candle range
- Little or no upper wick
- Forms at or near a key support level, moving average, or trend line
How to trade it: When a bullish pin bar forms at a key support level during an uptrend, enter a CALL option at the open of the next candle. Expiry should be set at the next major resistance level in time — typically 3–5 candles ahead on your trading timeframe.
Bearish pin bar characteristics:
- Long upper wick (at least 2x the body length)
- Small body positioned in the lower third of the total candle range
- Little or no lower wick
- Forms at or near a key resistance level during a downtrend
How to trade it: Enter a PUT option at the open of the next candle, with expiry selected based on the distance to the next meaningful support level.
Win rate expectation: Pin bars at key confluence zones (support/resistance + moving average + trend direction) have documented win rates of 60–72% in backtesting across multiple forex pairs and timeframes.
Pattern 2: The Inside Bar Breakout
The inside bar is a two-candle pattern where the second candle (the inside bar) has both its high and its low contained entirely within the range of the preceding candle (the “mother bar”). This pattern represents a pause in momentum — a period of consolidation after a strong move — and is typically a precursor to a continuation of the preceding trend.
Why inside bars work: During the inside bar formation, the market is in equilibrium. Buyers and sellers are momentarily balanced. When price eventually breaks out of the inside bar’s range, it reveals which side has won the standoff — and often produces a rapid, directional move as the losing side covers.
Trading the inside bar for binary options:
- Identify the inside bar pattern following a clear trending move
- Note the high and low of the inside bar (the “breakout levels”)
- Enter a CALL option if price breaks above the inside bar high (bullish breakout in an uptrend)
- Enter a PUT option if price breaks below the inside bar low (bearish breakout in a downtrend)
- Set expiry to give the trade time to reach the next significant level — typically the length of the mother bar projected from the breakout point
Important context: Inside bars are most reliable when they form during a clean trend, not in choppy, sideways markets where false breakouts are common.
Pattern 3: The Engulfing Candle
The engulfing pattern is a two-candle reversal signal that is more aggressive than the inside bar. In an engulfing pattern, the second candle completely “engulfs” the first — its body extends both above the high and below the low of the preceding candle. This represents a decisive shift in momentum from one side to the other.
Bullish engulfing: A large green (bullish) candle that completely engulfs the preceding red (bearish) candle. When this pattern forms at a support level, it strongly suggests that buyers have overwhelmed sellers and a reversal or bounce is likely. Trade with a CALL option.
Bearish engulfing: A large red candle that completely engulfs the preceding green candle at a resistance level. This signals that sellers have decisively taken control. Trade with a PUT option.
Enhancing engulfing pattern reliability: The pattern’s reliability increases significantly when it forms on higher-volume sessions (London or New York open), at major support/resistance levels, or at round-number price points (e.g., 1.0800 in EUR/USD).
Building Your Complete Binary Options Price Action System

Step 1: Choose Your Timeframe
For binary options, the 15-minute chart with 30-minute to 1-hour expiry is a popular starting point. It provides enough candle detail to identify reliable patterns without being overwhelmed by noise, and the expiry gives the trade enough time to develop without being subject to overnight risk.
Step 2: Define Your Key Levels
Before each session, draw the most important support and resistance levels on your chart. These are the zones where you will look for price action signals. Key levels include: previous day high and low, round numbers, weekly and monthly pivot points, and areas where price has repeatedly reversed.
Step 3: Wait for Confluence
Never take a trade based on a pattern alone. Require at least two confirming factors: a pattern forming at a key level, in the direction of the trend, ideally during a high-liquidity session. The more factors align, the higher the probability of success.
Step 4: Apply Strict Money Management
Risk no more than 2–3% of your account on any single binary options trade. With a $500 account, that is $10–$15 per trade. This conservative approach may feel frustrating when you are confident in a trade, but it is the only way to survive the inevitable losing streaks that affect even the best traders.
Common Price Action Mistakes to Avoid
- Trading patterns in isolation: A pin bar in the middle of a range with no clear trend context is not a high-probability trade. Always require context.
- Chasing trades: If you missed the ideal entry point at candle open, do not enter mid-candle. Wait for the next setup.
- Ignoring higher timeframes: Always check the daily chart direction before taking trades on the 15-minute chart. Trading against the daily trend dramatically reduces your win rate.
- Overtrading: High-probability price action setups do not appear every 5 minutes. On many days, the correct trade count is zero. Waiting for quality over quantity is the hallmark of professional price action trading.
Frequently Asked Questions
Can price action trading make you profitable in binary options?
Yes, but it requires extensive practice, backtesting, and disciplined live application. Traders who spend at least 3–6 months paper trading their price action system before going live with real money have significantly better outcomes than those who jump straight to live trading.
What timeframe is best for binary options price action?
The 5-minute to 15-minute chart is most popular for shorter expiry options (15–60 minutes). The 1-hour chart works well for end-of-day expiry options. Avoid using the 1-minute chart for price action — there is too much noise and patterns are unreliable.
Do I need any indicators with price action trading?
Pure price action requires no indicators. However, many traders find it helpful to display moving averages (20 EMA, 50 EMA) on their chart as dynamic support/resistance levels, even while keeping the chart otherwise clean. This is a matter of personal preference rather than necessity.
⚠️ Risk Disclaimer: Binary options trading involves significant risk of financial loss. No trading strategy, including price action, guarantees profits. This article is for educational purposes only. Always practice on a demo account before trading with real capital.
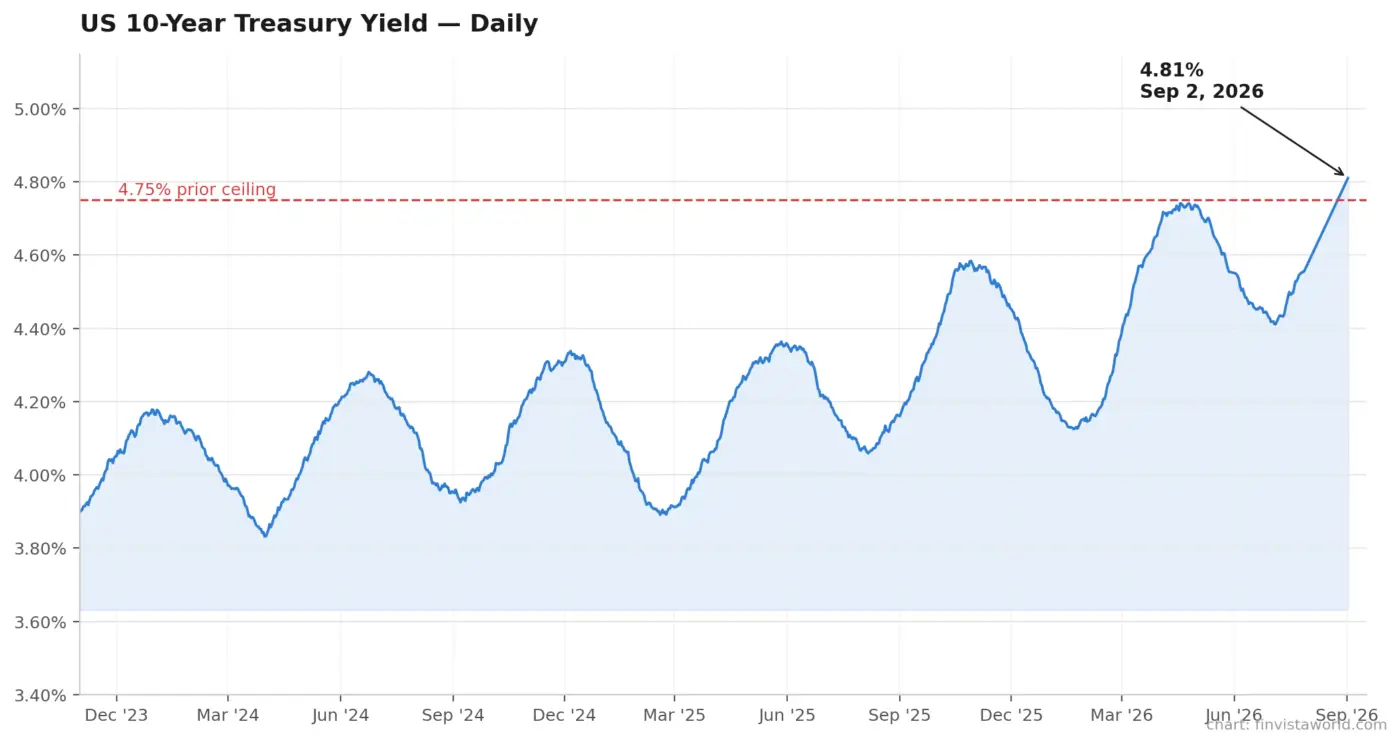 ADP Jobs Miss Collides With Rising Yields: Wall Street Stalls as 10-Year Hits 4.81%
 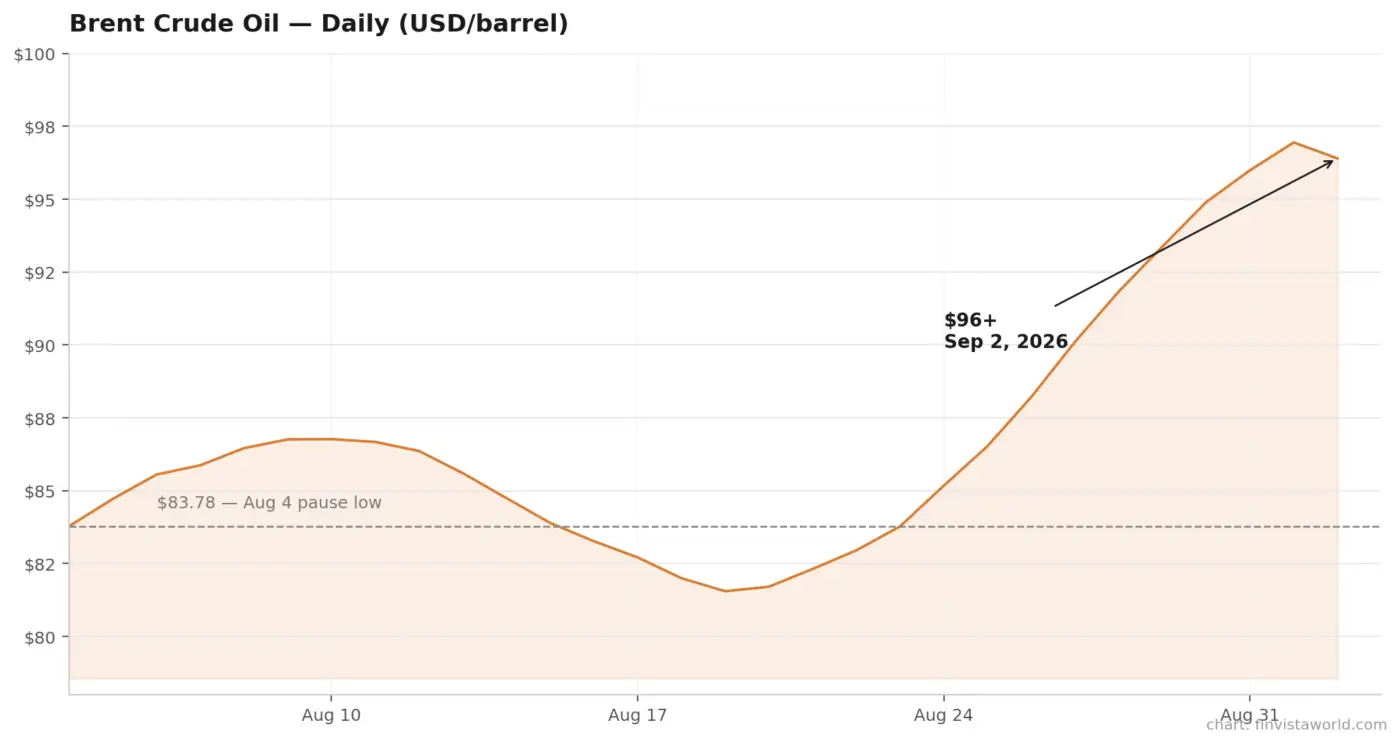 Iran War Reignites: Oil Tops $96, Stocks and Gold Slide Together as Fed Rate-Hike Odds Hit 70%
  Oil Sinks 6%, Dow Hits Record High as Iran Pause Reprices Markets – Crypto Sits It Out
 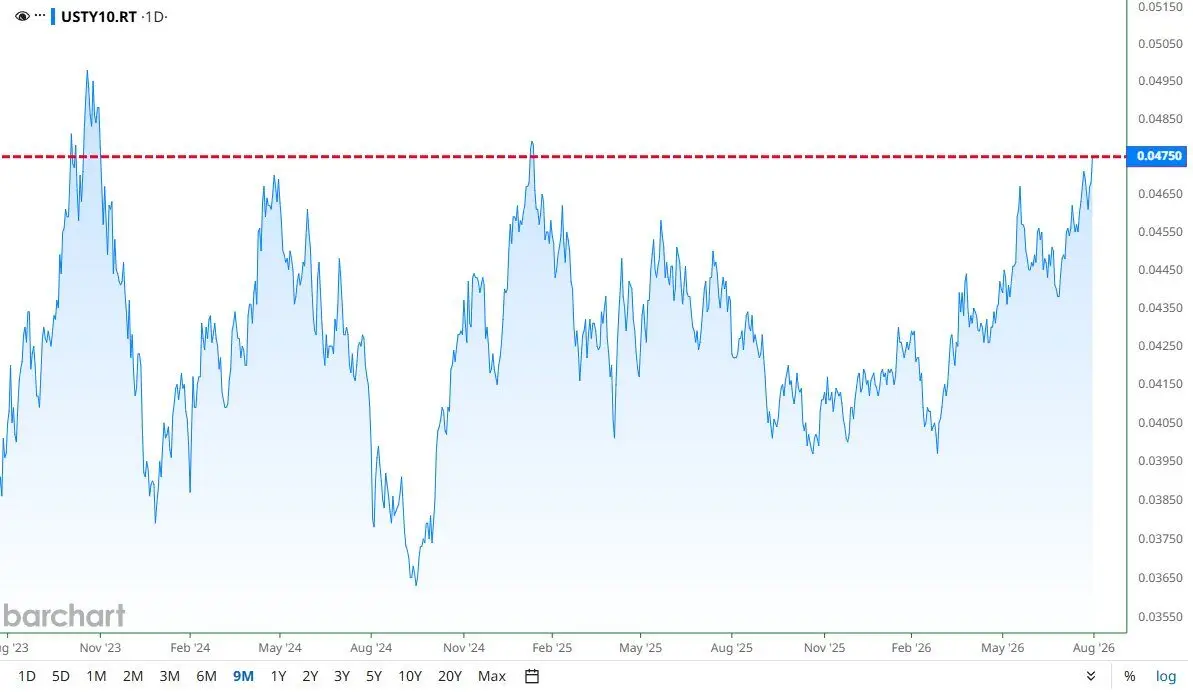 10-Year Yield Hits 4.75%, an 18-Month High – Why the Bond Market Is About to Revolt
  Bond Market Puts Warsh’s 2% Promise to the Test as 30-Year Yield Hits 19-Year High
 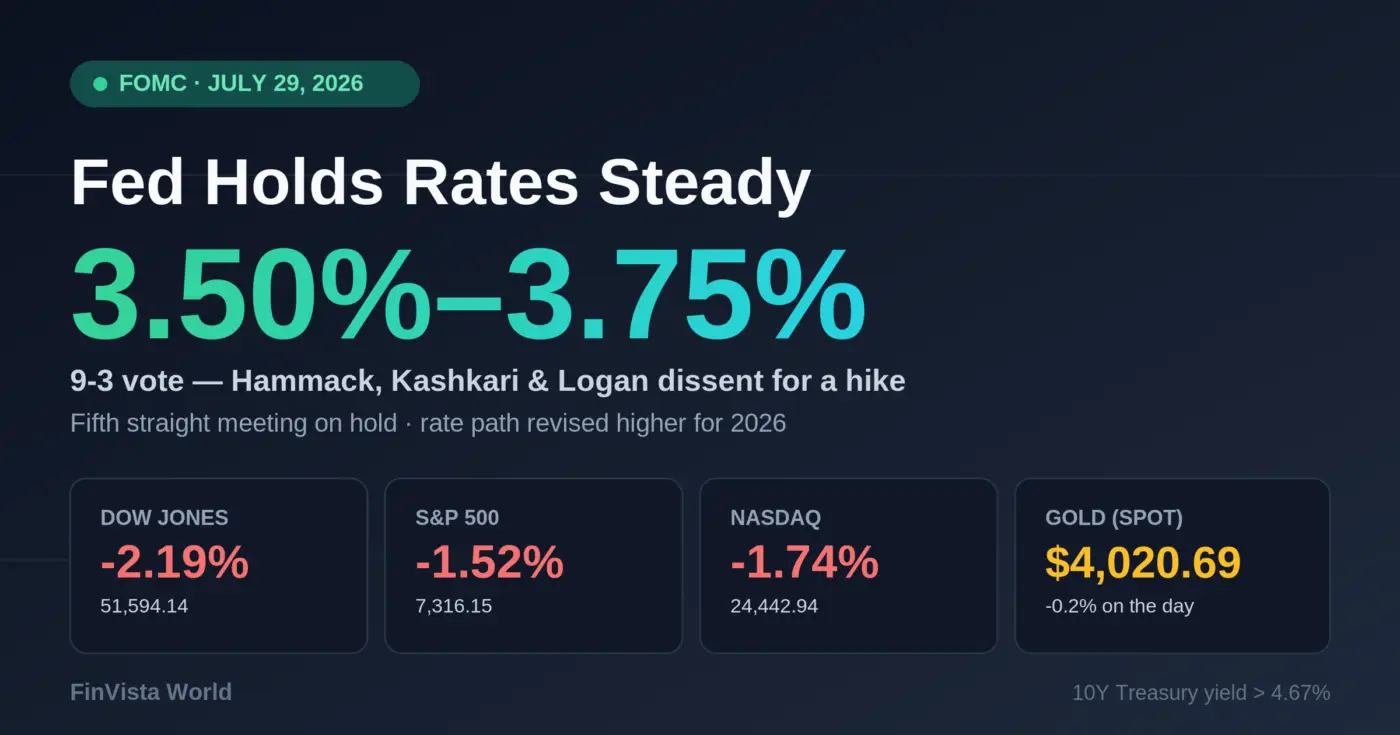 Fed Holds Rates Steady at July 2026 Meeting as Three Officials Dissent, Stocks Tumble