
Ethereum is trading close to a key fair-value zone, with buyers showing modest improvement but still needing a clean push above $1,813 to confirm a stronger breakout attempt.

ETH is balanced, not yet breaking out
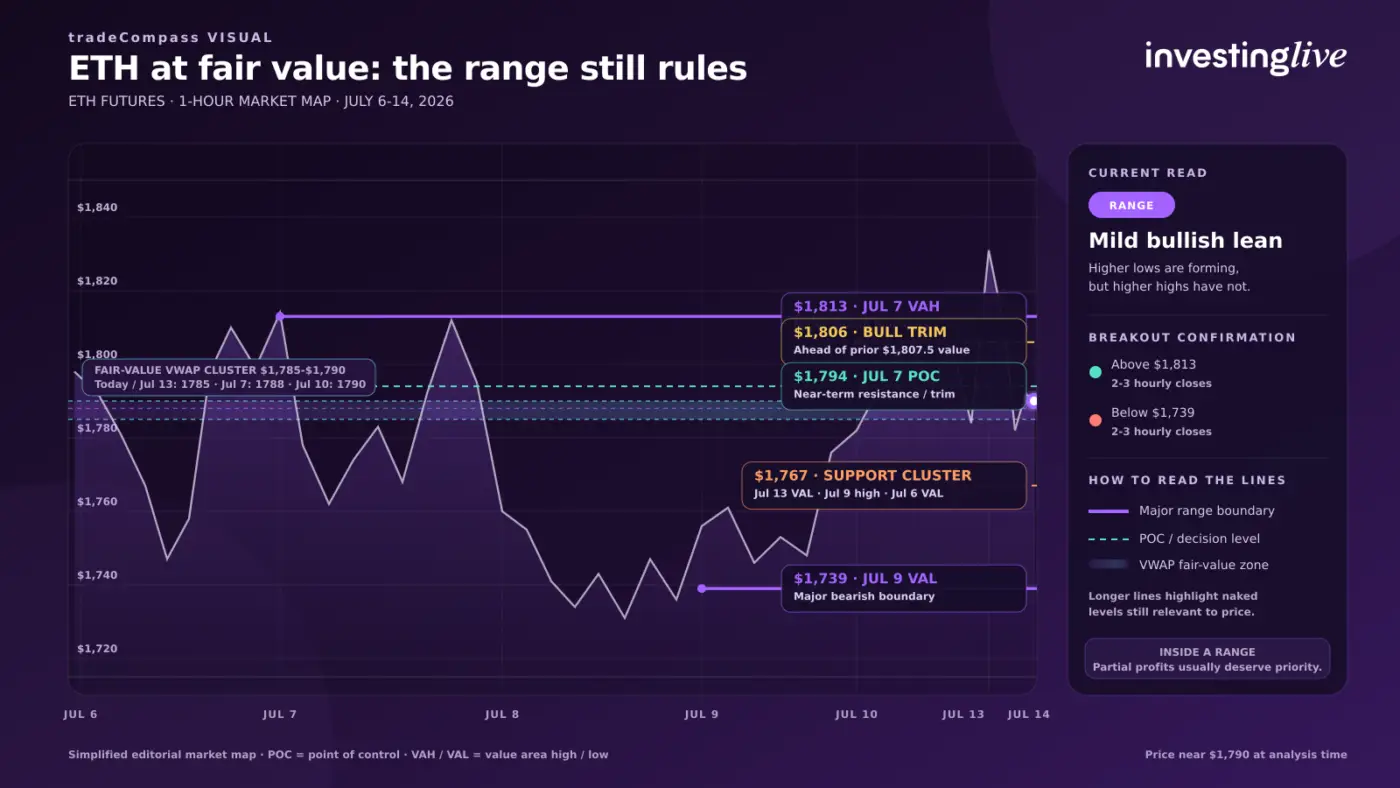
Ethereum futures are sitting near the middle of a recent trading range, around the $1,785–$1,790 area. That zone has acted like a magnet for price because several VWAP references are clustered there, suggesting the market has repeatedly treated it as short-term fair value.
The short-term tone leans slightly positive because ETH has been forming higher lows after recovering from the $1,750 region. Still, that alone is not enough to call a new uptrend. Buyers also need to prove they can create higher highs and hold above resistance.
Why the $1,785–$1,790 area matters
The current Ethereum price zone is important because multiple session VWAPs sit in the same narrow band. Today’s developing VWAP, the previous closing VWAP, and several recent session VWAP references are all close to the $1,785–$1,790 area.
When several VWAP levels converge, price often becomes choppy. Traders may see overlapping candles, two-way movement, and failed attempts to chase momentum. That makes the middle of the range less attractive than waiting for a cleaner test of support, resistance, or confirmed acceptance outside the range.
The main breakout levels: $1,813 and $1,739
The clearest upside level is around $1,813, which lines up with a recent value-area high. A simple wick above that level would not be enough, because crypto markets often sweep obvious resistance before rotating back into the prior range.
A stronger bullish confirmation would require ETH to hold above $1,813 for several hourly candles. That would show acceptance above resistance rather than a short-lived liquidity grab. On the downside, the equivalent breakdown level is around $1,739. Sustained hourly closes beneath that level would shift control toward sellers.
Bearish breakdown
Fair value
Bullish breakout
Bullish trade map: what buyers need next
A tactical bullish case begins to improve if ETH can remain above approximately $1,795 and then establish itself above the psychological $1,800 level. From there, traders would watch whether price can challenge $1,806, $1,812, and ultimately the major $1,813 boundary.
If ETH accepts above $1,813, the next upside areas to monitor are roughly $1,827 and then the wider range high near $1,848–$1,850. Those levels are not guaranteed targets, but they provide a practical map for managing risk if buyers take control.
Bullish levels to watch
Bearish trade map: where weakness would show
The first warning sign for bulls would be a move back below the VWAP cluster. A more meaningful bearish signal appears near $1,782, where short-term structure would begin to deteriorate.
If ETH weakens, the next areas to watch are approximately $1,778, $1,767, $1,755 and $1,741. The $1,767 region is especially important because it combines several prior market references, which may attract dip buyers or encourage short sellers to reduce exposure.
Bearish levels to watch
weakness trigger
key target
near range low
major breakdown
Risk management matters inside a range
Because ETH is still trading inside a range, partial profit-taking can be useful. Range markets often reverse after reaching obvious levels, so traders who wait for every move to become a full breakout can give back gains quickly.
A practical approach is to reduce part of a position at the first meaningful target, tighten risk after the second target, and keep only a smaller position for a potential larger move. This helps balance the opportunity of a breakout with the reality that most range attempts fail before the decisive move appears.
FinVista takeaway
Ethereum’s setup is constructive but not confirmed. Higher lows show that buyers are defending better than before, yet ETH still needs sustained acceptance above $1,813 to prove a real breakout. Until then, the $1,785–$1,790 area remains the market’s short-term balance zone, while $1,739 defines the level where sellers would gain a stronger edge.
This article is a rewritten market analysis based on InvestingLive’s Ethereum futures level map. It is for educational purposes only and is not financial advice.
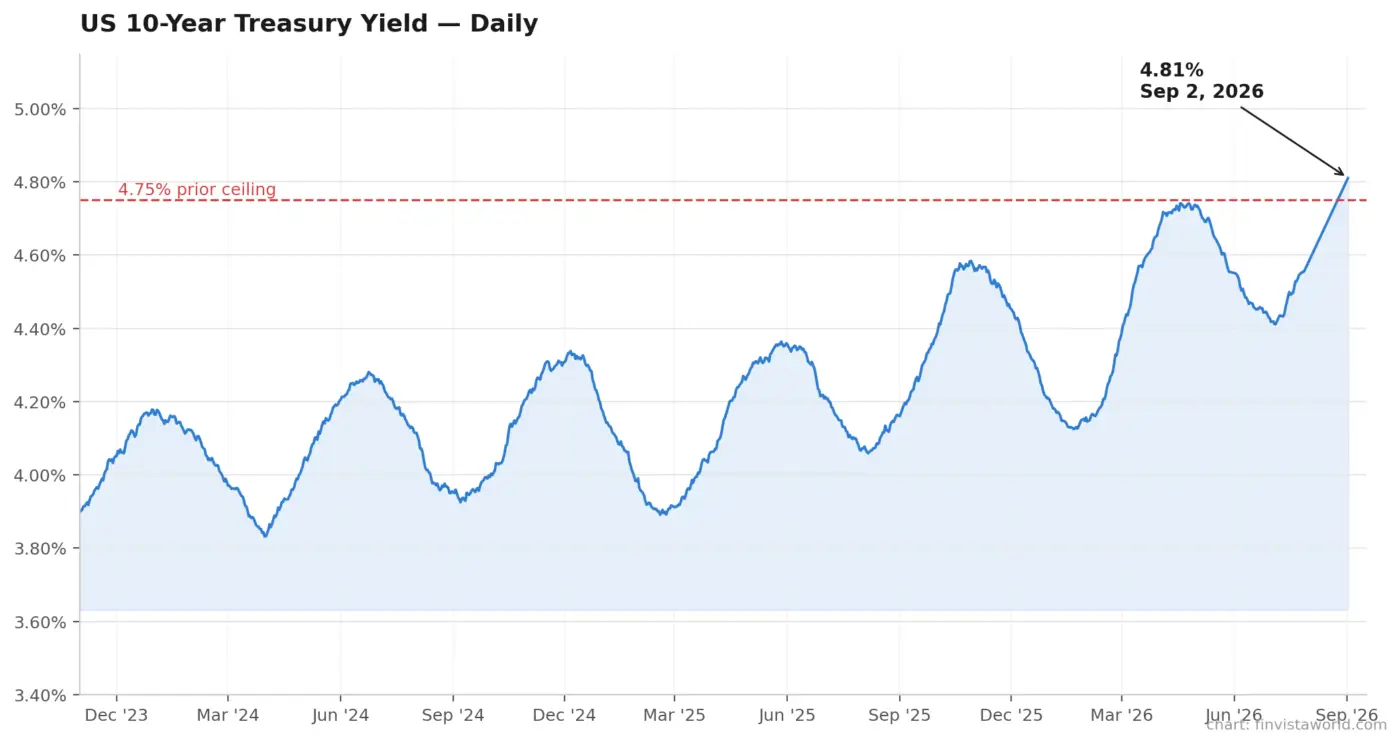 ADP Jobs Miss Collides With Rising Yields: Wall Street Stalls as 10-Year Hits 4.81%
 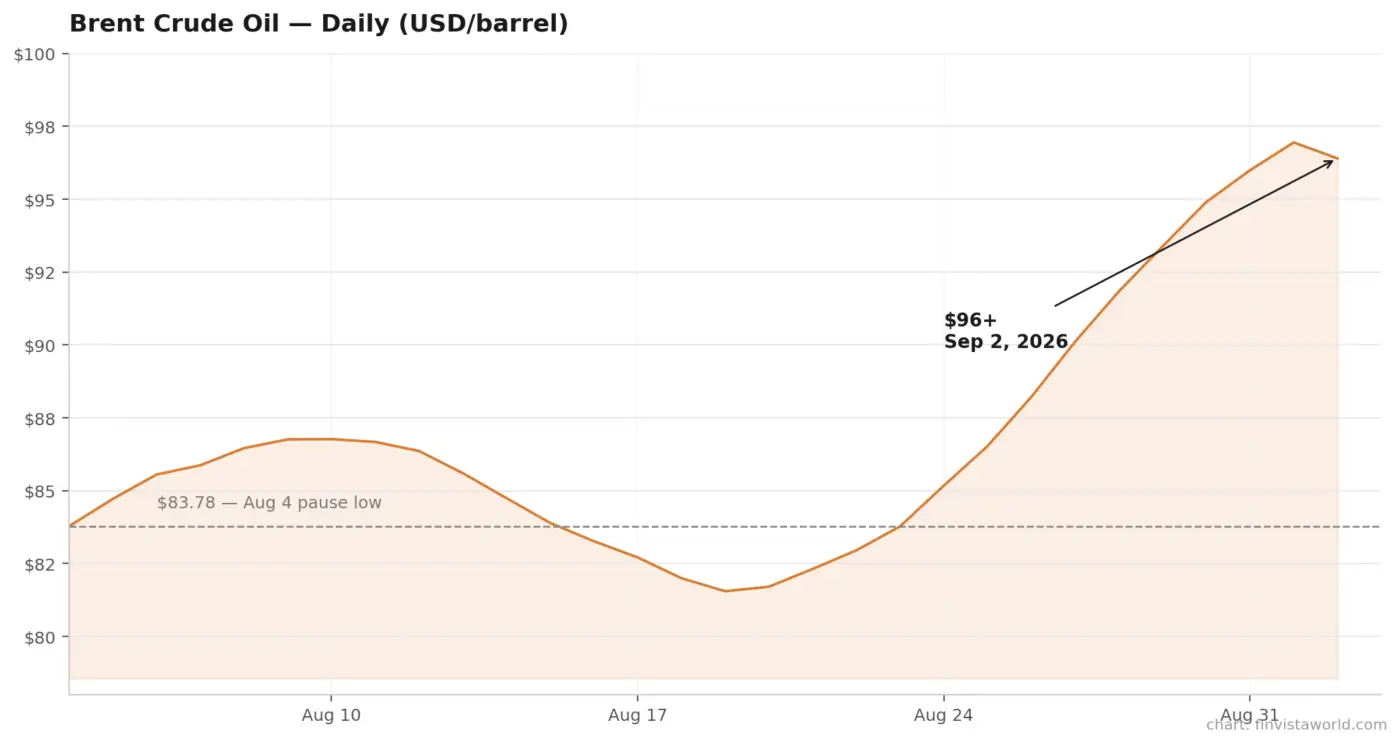 Iran War Reignites: Oil Tops $96, Stocks and Gold Slide Together as Fed Rate-Hike Odds Hit 70%
  Oil Sinks 6%, Dow Hits Record High as Iran Pause Reprices Markets – Crypto Sits It Out
 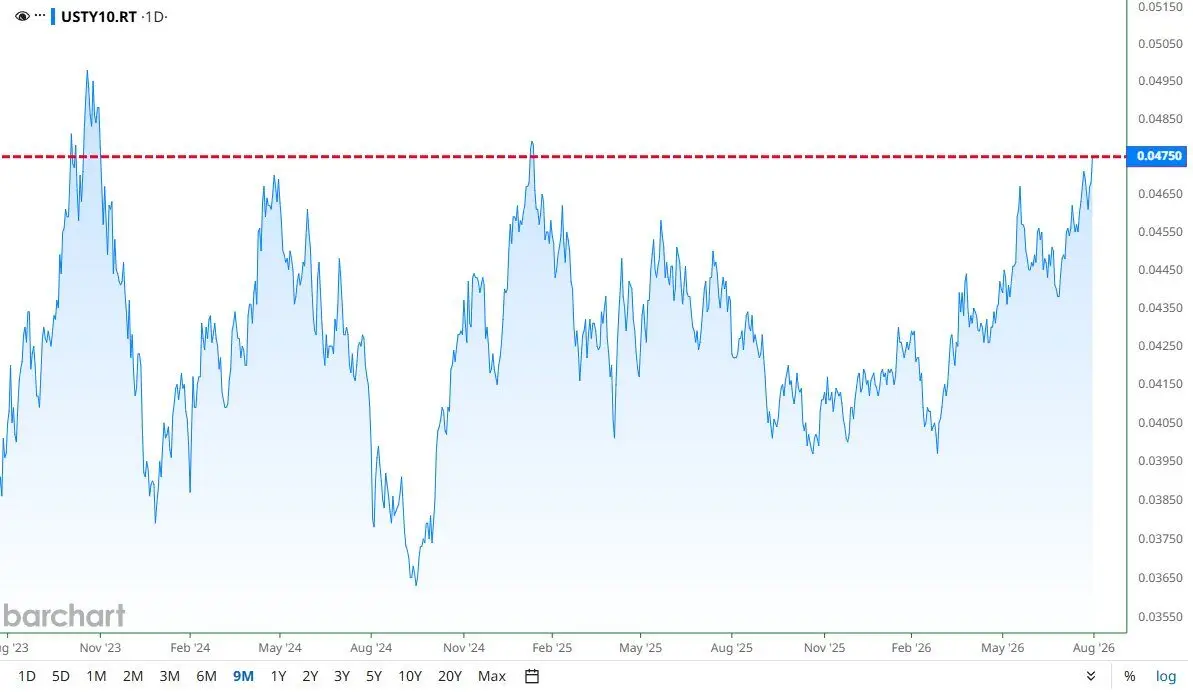 10-Year Yield Hits 4.75%, an 18-Month High – Why the Bond Market Is About to Revolt
  Bond Market Puts Warsh’s 2% Promise to the Test as 30-Year Yield Hits 19-Year High
 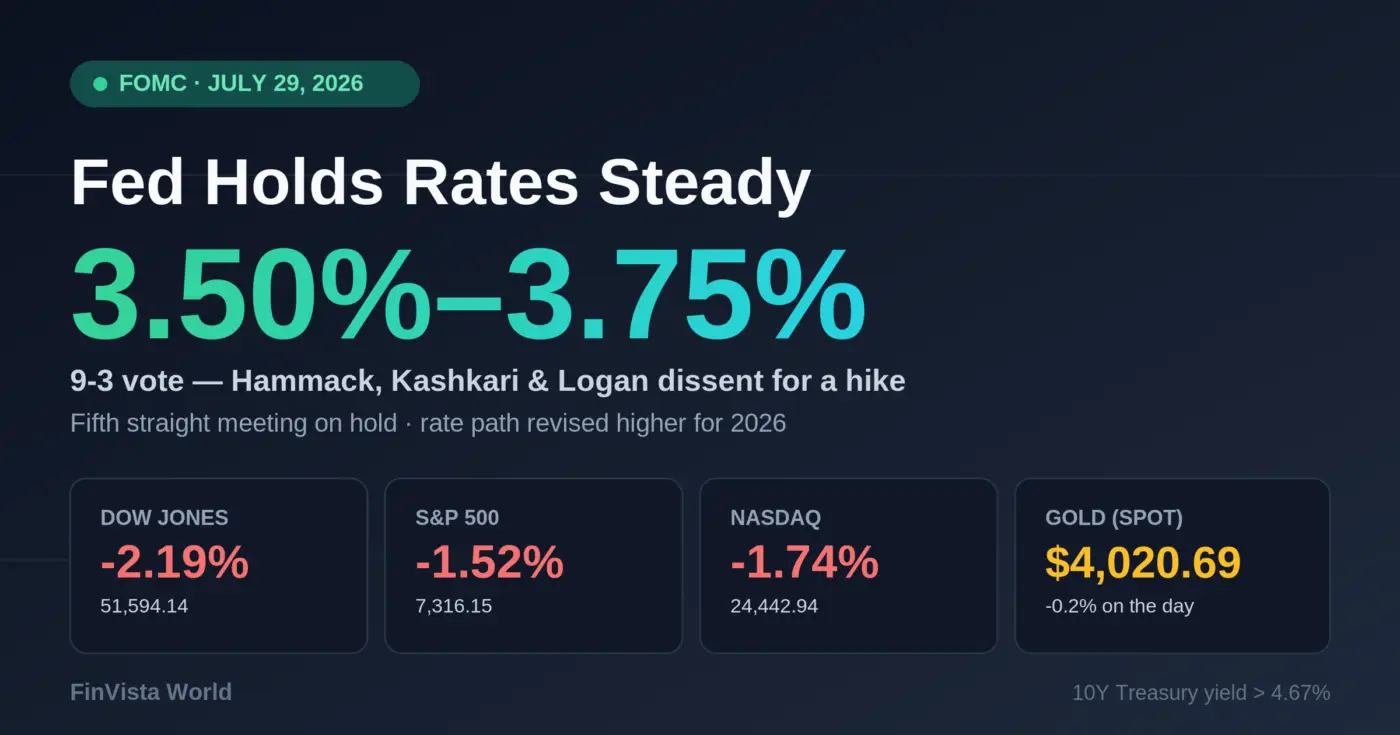 Fed Holds Rates Steady at July 2026 Meeting as Three Officials Dissent, Stocks Tumble